 Reach out - [email protected] for your AI B2B Marketing and Thought Leadership content requirements. AI: Leadership & Best Practices
AI: Data & Governance
AI: Use cases
Team development
Misc
Comments
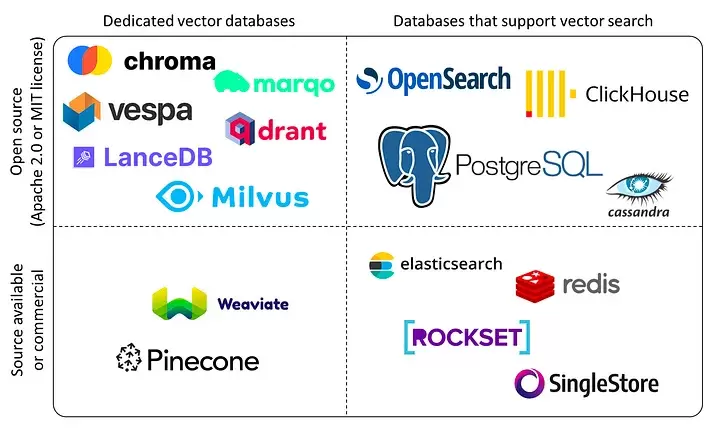 Vector databases have recently gained prominence with the rise of large language models and generative AI. A vector database is a data store for unstructured text in the form of vector embeddings for various AI models and applications. Embeddings are a high dimensional vector representation of text that conveys rich semantic information and represent an efficient way of capturing unstructured data like text.
The rising popularity of large language models like GPT-4, Gemini, Claude-2, Llama-2, Mixtral and others have fuelled tremendous interest in generative AI across the industry to build applications based on these models. Vector databases are specialized for handling vector data that is used to train or fine-tune these foundational models for domain and company specific use cases. Unlike traditional scalar-based databases, vector databases offer optimized storage and querying capabilities for vector embeddings. Although several vector databases are now available in the market like Pinecone, Chroma, Qdrant amongst others, deciding which vector database to choose for enterprise use cases is not a straightforward decision. In this article, you will learn how to decide which vector database to choose for your organization based on criteria like performance, reliability, scalability, cost-efficiency, developer experience, security, technical support amongst others. Key Considerations In this section, you will learn in detail about each of the key factors that should be considered to make your final selection of a vector database. These include data and use case characteristics, performance, functionality, enterprise-readiness, developer experience, and future roadmap. 1. Data and Use Case It is important to work backwards from the specific business use case that you are planning to solve by leveraging organizational data and the latest techniques from the field of generative AI. For instance, if your business objective is to build an enterprise knowledge management chatbot like McKinsey’s Lilli, you will need to organize and prepare all the in-house text data such as documents, emails, chat messages etc. The use case defines several aspects of the data, including its size, frequency, data type, growth in the volume of data over time, data freshness and consequently the nature of the underlying vector embeddings to be stored in the vector database. These vectors may be sparse, dense, and also span multiple modalities depending on the use case. Additionally, careful planning and scoping of the use case also helps you understand other crucial aspects such as the number of users, the number of queries per day, the peak number of queries at any given instant, as well as the query patterns of the users. Vector databases utilize indexing and vector search powered by k-nearest neighbors (kNN) or approximate nearest neighbor (ANN) algorithms. This empowers a vector db to perform similarity search and identify the most similar vectors in the database. This capability underlies enterprise use cases based on natural language processing such as question-answering, document analysis, recommender systems, image and voice recognition etc. 2. Performance 2.1 Query latency and query per second (QPS) The primary performance metrics of a vector db are the query latency, i.e., the time it takes to run a query and get the result and the query per second that defines the throughput in terms of the number of queries processed in a second. These parameters are critical for ensuring a seamless user experience for several applications that require real-time results such as chatbots. Typical QPS values range from ~50-300 and the average query latency from 25-100 ms depending on the underlying hardware. 2.2 Scalability Scalability measures the ability of the vector database to grow and expand further to support the requirements of its customers. The scale can be measured in terms of the number of embeddings that can be supported and in terms of horizontal scaling of existing resources and vertical scaling of additional servers. Typically, most existing vector db companies provide scale-out capabilities up to a billion vectors without any performance degradation. If the resources can scale automatically, then you can be rest assured that your application will always be up and running. 2.3 Accuracy A vector database is as good as its accuracy of retrieving the right set of results based on the user queries. Here, the choice of vector search algorithms to identify data sources with similar embeddings as the embedding of the user query is pivotal. There are several different algorithms used for powering vector search such as kNN, ANN, FAISS, NGT. These algorithms generate approximate results and the best vector databases provide a good trade-off between speed and accuracy. 3. Functionality 3.1 Filtering on metadata In practice, filtering vector search results based on the metadata helps reduce the search space, thus providing for faster and more accurate search results. Typical metadata includes information like dates, versions, tags and the ability of a vector database to store multiple metadata fields allows for a better search experience. 3.2 Integrations Integrating a vector database into the existing data and engineering infrastructure in your organization is critical to faster adoption and lesser time to value. The ability of vector databases to seamlessly integrate with essential infrastructure elements like the cloud infrastructure, underlying large language models, databases etc. is a key factor to consider. 3.3 Cost-efficiency While performance metrics and functionality are core to a technology, the cost should be reasonable and fit your budget. The pricing of vector databases is a function of the number of ‘write’ operations such as update and delete and the number of queries. Other factors that affect the cost include the dimensionality of the embedding, the number of vectors stored in the database, and the size of the metadata. Depending on your use case and requirements, it is essential to estimate the overall cost of running your application at scale on a monthly or quarterly basis and evaluate the overall costs relative to your budget and the expected revenue from running the AI applications. 4. Enterprise-readiness 4.1 Security and compliance For most enterprise companies, it is imperative that any external vendor they employ meets strict security and compliance requirements. These requirements include SOC2, GDPR, HIPAA, ISO compliance and others, depending on the domain in which the company operates. The data privacy and security standards have gone up in the light of recent cybersecurity attacks and breaches of customer data, and you should ensure that any vector db vendor meets your specific security and compliance requirements. 4.2 Cloud setup Several modern companies have undergone digital transformation and house their entire data and infrastructure in the cloud vs on-premise. You may choose to manage and maintain your infrastructure via a self-hosted setup or go for a fully managed SaaS platform. The benefit of a fully managed system is that it automates clusters with minimal requirements for you to provision and scale clusters or take care of operational issues. 4.3 Availability Availability, i.e. the ability of your vector db to run without any interruptions, issues or downtime is essential to not adversely impact user experience. Most vector database providers vouch for specific SLAs which should meet the requirements for your applications. Typical values include 99.9% for uptime SLA and a few hours to a few business days for response time SLA depending on the severity of the production issue. 4.4 Technical support More often than not, you might be stuck facing some issues with your vector db and need some hands-on support from the vendor to help troubleshoot the issue. Does the company provide you with a dedicated team who can be available at a short notice to get on a call and figure out how to solve the problem? The quality of responsiveness and customer support experience provided by a vector db company is valuable and helps you develop a stronger sense of trust in the company. 4.5 Open source vs Closed source Some vector db companies are closed source and operate under a proprietary license such as Pinecone. At the same time, there are a host of vector db companies that are open source under the Apache 2.0 license such as Qdrant or Chroma while also offering a fully managed service. This can also influence your choice of the vector db provider. 5. Developer experience 5.1 Community Software and AI engineers are the core professionals who will work on the vector db and integrate it in the company’s infrastructure and deploy your generative AI application to production. Therefore, the quality of experience that developers have with a vector db solution is integral in shaping your final decision. Having an open-source community on Slack or Discord helps build more engagement and trust with developers than commercial vendor support. It provides your developers an opportunity to learn from developers at other companies as well and discuss and solve issues by leveraging the wisdom of the community. 5.2 Onboarding Onboarding a new technology is challenging as it determines the time your developer team takes to properly understand the product, integrate it, troubleshoot any issues, and become an expert in using the vector database. The availability of APIs and SDKs as well as clear product demos and documentation goes a long way in reducing the barriers to understanding a new vector database so that your developers can build with speed and confidence. 5.3 Time to value Similar to the time to onboard a new vector db, another important factor is the time to business value. If a vector db provider vouches for a fast deployment of a production-ready application, then you can realize value sooner, and meet your business goals faster as well. A long gestation time from onboarding to business value is a deterrent for many fast-moving companies and startups especially in the current frantic race to adopt and ship generative AI applications. 5.4 Documentation The quality of the vector database’s documentation determines the time to onboard, time to value, and trust in the provider’s expertise and product. Clear instructions with tutorials, examples and case studies help your developers understand and master the vector db faster. 5.5 User education Similar to community-based offerings, expert technical content such as blogs, demos and videos focused on the existing as well as new features are helpful for your team to understand and build faster. In addition to text and video content, other offerings like user testimonials, workshops, conferences also help educate your team and build more trust in the vector db provider. 6. Future roadmap A final factor to consider is the product roadmap of the vector database provider. Vector databases are an emerging technology that will need to continuously evolve alongside the advances in generative AI models, chip design and hardware, and novel enterprise use cases across domains. Therefore, the vector db vendor should show the potential for evaluating long-term and future industry trends such as sophisticated vectorization techniques for a wider variety of data types, hybrid databases, optimized hardware accelerators for AI applications such as GPUs and TPUs, distributed vector dbs, real-time and streaming data based applications, as well as industry-specific solutions that might require advance data privacy and security. Conclusion Vector databases are an essential ingredient for modern generative AI applications built on unstructured data such as text. Their popularity has increased in parallel to the developments in the generative AI field such as large language models, large image models etc. to serve as the underlying database for handling high-dimensional data stored as vector embeddings. In this article, you learned about several important pillars to help your decision making about the choice of the vector database. These factors include data and use case considerations, performance-based requirements such as query speed and scalability, functionality requirements such integrations and cost-efficiency, enterprise-readiness including security and compliance, and developer experience including community and documentation. Several vector database companies have emerged to build this foundational infrastructure. There is no single ‘best’ vendor of vector db and the ultimate choice is highly contingent on your organization’s business goals. Therefore, a data-driven approach guided by the factors listed in this article will help you select the most optimal vector db for your organization. 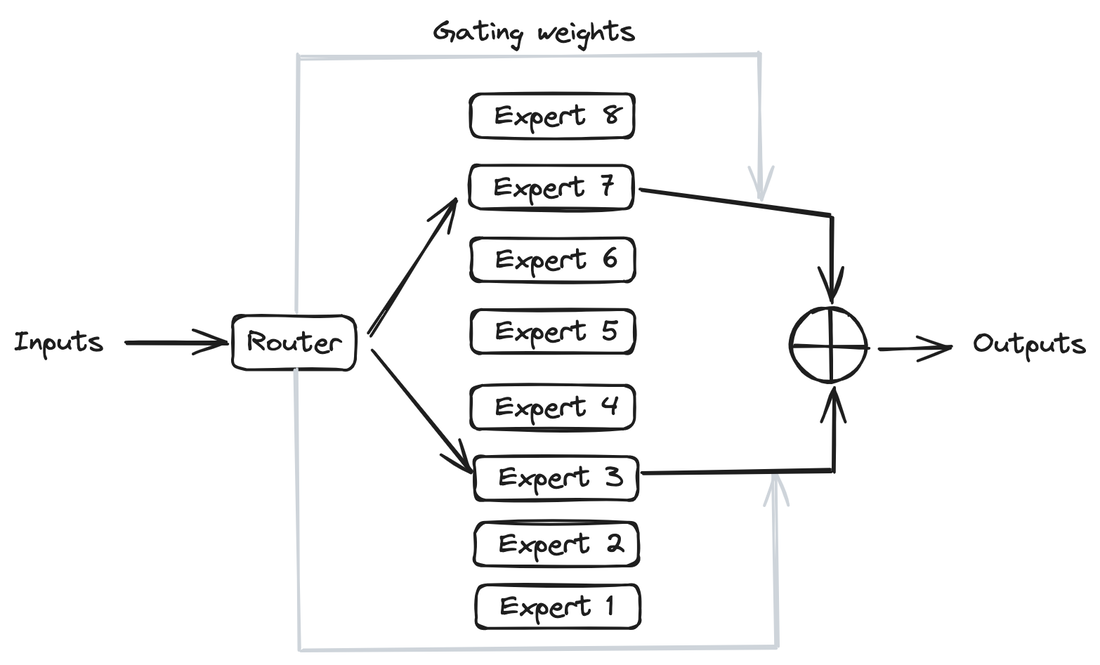 Figure 1 - Mixture of Experts layer. 1. Introduction Mistral is a pioneering French AI startup that launched their own foundational large language model, called Mistral 7B in September 2023. As of the date of launch, it was the best 7 billion parameter language model, outperforming even larger language models like Llama 2 of size 13 billion parameters across multiple benchmarks. In addition to its performance, Mistral 7B is also popular as the model is open-sourced under the Apache 2.0 license with the model weights available for download. Mixtral 8x7B (hereafter, referred to as “Mixtral”) is the latest model released by Mistral in January 2024 and represents a significant extension of their prior work on Mistral 7B. It is a 7B Sparse Mixture of Experts (SMoE) language model with stronger capabilities than Mistral 7B. It uses 13B active parameters during inference out of a total of 47B parameters, and supports multiple languages, code, and 32k context window. In this blog, you will learn about the details of the Mixtral language model architecture, its performance on various standard benchmarks vis-a-vis state-of-the-art large language models like Llama 1 and 2 and GPT3.5, as well as potential use cases and applications. 2. Mixtral Mixtral is a mixture-of-experts network, similar to [GPT4]. While GPT4 is said to constitute 8 expert models of 222B parameters each, Mixtral is a mixture of 8 experts of 7B parameters each. Thus, Mixtral only requires a subset of the total parameters during decoding, thus allowing faster inference speed at low batch sizes and higher throughput at large batch sizes. 2.1 Sparse Mixture of Experts Figure 1 illustrates the Mixture of Experts (MoE) layer. Mixtral has 8 experts, and each input token is routed to two experts with different sets of weights. The final output is a weighted sum of the outputs of the expert networks, where the weights are determined by the output of the gating network. The number of experts (n) and the top K experts are hyperparameters that are set to 8 and 2 respectively. The number of experts, n determines the total or sparse parameter count while K determines the number of active parameters used for processing each input token. The MoE layer is applied independently per input token in lieu of the feed-forward sub-block of the original Transformer architecture. Each MoE layer can be run independently on a single GPU using a model parallelism distributed training strategy. 2.2 Mistral 7B Mixtral’s core architecture is similar to Mistral 7B, and therefore, a review of its architecture is relevant for a more comprehensive understanding of Mixtral. Mistral 7B is based on the Transformer architecture. In comparison to Llama, it has a few novel features that contribute to it surpassing Llama 2 (13B) on various benchmarks. 2.2.1 Grouped-Query Attention Grouped-Query Attention (GQA) is an extension of multi-query attention, which uses multiple query heads but single key and value heads. Popular language models like PaLM employ multi-query attention. GQA represents an interpolation between multi-head and multi-query attention with single key and value heads per subgroup of query heads. As shown in figure 2, GQA divides query heads into G groups, each of which shares a single key and query head. It is different to multi-query attention which shares single key and value heads across all query heads. GQA is an important feature as it significantly accelerates the speed of inference and also reduces the memory requirements during decoding. This enables the models to scale to higher batch sizes and higher throughput, which is a critical requirement for real-time AI applications. 2.2.2 Sliding Window Attention Sliding window attention (SQA), introduced in the Longformer architecture exploits the stacked layers of a Transformer to attend to information beyond the typical window size. SWA is designed to attend to a much longer sequence of tokens than vanilla attention, and also offers significant reductions in computational cost. The combination of GQA and SWA collectively enhance the performance of Mistral 7B and therefore Mixtral relative to other language models like the Llama series. 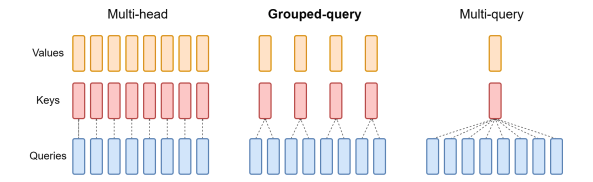 Figure 2. A comparison of the configuration of key, value and query heads for GQA vs. multi-head and multi-query attention. 3. Performance 3.1 Standard benchmarks The authors of Mixtral benchmarked the performance of the model on a range of standard benchmarks and evaluated the accuracy of Mixtral versus leading language models like Llama 1, Llama 2, and GPT3.5 as shown in figure 3, table 1, and table 2. In summary, Mixtral is better than much larger language models with up to 70B parameters like Llama 2 70B while only using 13B (~18.5%) of the active parameters during inference. Mixtral’s performance is especially superior in tasks focused on mathematics, code generation, as well as multilingual comprehension. 3.2 Multilingual understanding Table 3 shows the performance of Mixtral versus Llama models on multilingual benchmarks. As Mixtral was pretrained with a significantly higher proportion of multilingual data, it is able to outperform Llama 2 70B on multilingual tasks in French, German, Spanish, and Italian while being comparable in English. 3.3 Long-range performance As shown in figure 4, the input context length of language models has increased by several orders of magnitude in the last few years - from 512 tokens for the BERT model to 200k tokens for Claude 2. However, most large language models struggle to efficiently use the longer context. Nelson and colleagues showed that current language models do not robustly make use of information in long input contexts, and their performance is typically highest when the relevant information for tasks such as question-answering or key-value retrieval occurs at the beginning or the end of the input context, with significantly degraded performance when the the models need to access information in the middle of long contexts. Mixtral, which has a context size of 32k tokens, overcomes this deficit of large language models and shows 100% retrieval accuracy regardless of the context length or the position of the key to be retrieved in a long context. The perplexity, a metric that captures the capability of a language model to predict the next word given the context, decreases monotonically as the context length increases. Lower perplexity implies higher accuracy, and the Mixtral model is therefore capable of extremely good performance on tasks based on long context lengths as shown in figure 5. 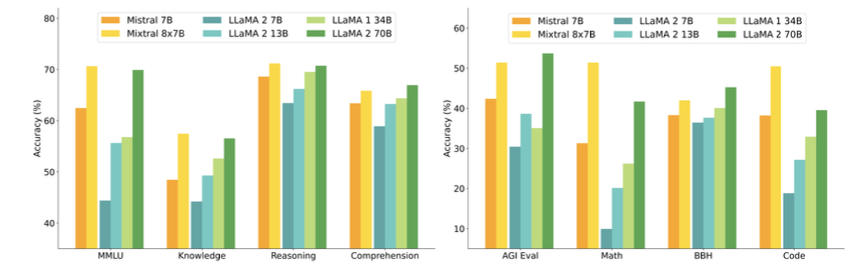 Figure 3. Performance of Mixtral in comparison to Llama 1 and 2 models of different sizes. 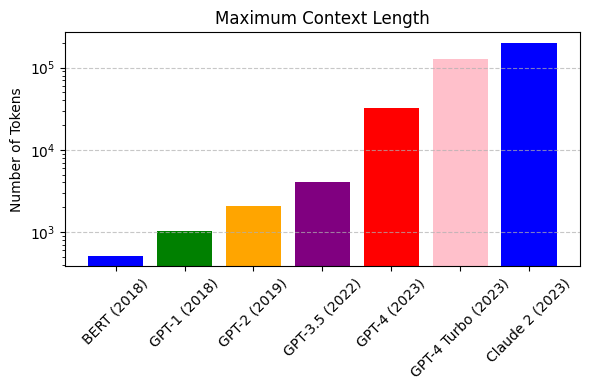 Figure 4. Evolution of the context length of large language models. 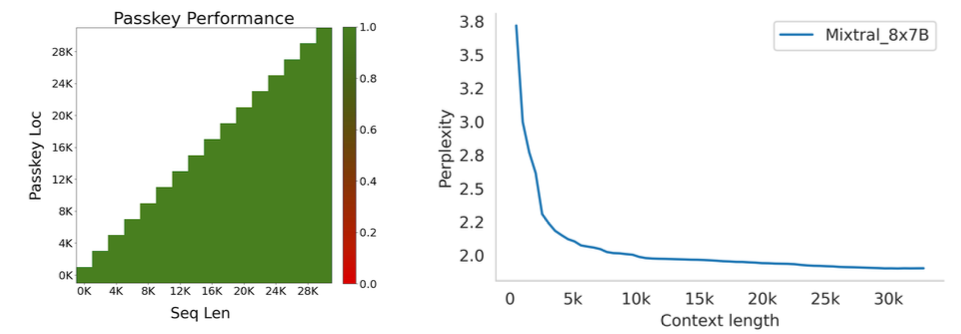 Figure 5. Long range performance of Mixtral. 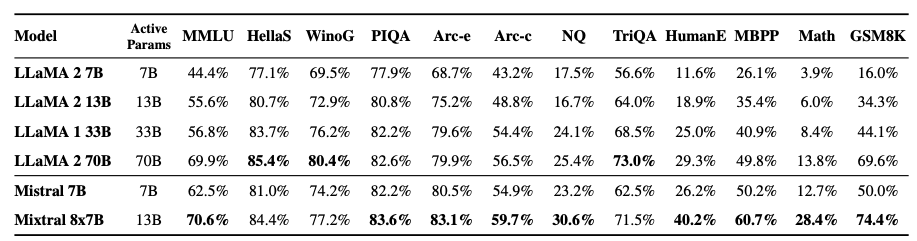 Table 1. Mixtral outperforms Llama 2 70B model on almost all benchmarks while using less than 1/5th of the active parameters during inference. 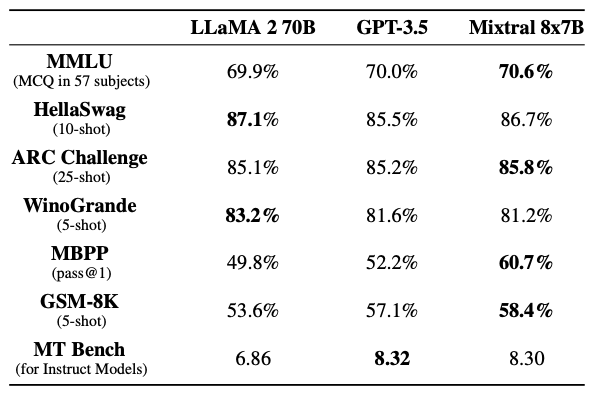 Table 2. Mixtral outperforms or matches the performance of Llama 2 70B and GPT-3.5 on most benchmarks.  Table 3. Mixtral’s performance on multilingual benchmarks for French, German, Spanish and Italian versus Llama 1 and 2 models. 4. Instruction Fine-tuning Instruction tuning refers to the process of further training large language models on a curated dataset containing (instruction, output) pairs of training samples. Instruction tuning is a computationally efficient method for extending the capabilities of large language models in diverse domains without extensive retraining or architectural changes. “Mixtral - Instruct” model was fine-tuned on an instruction dataset followed by Direct Preference Optimization (DPO) on a paired feedback dataset. DPO is a technique to optimize large language models to adhere to human preferences without explicit reward modeling or reinforcement learning. As of January 26, 2024, on the standard LMSys Leaderboard, Mixtral - Instruct continues to be the best performing open-source large language model. This leaderboard is a crowdsourced open platform for evaluating large language models that ranks models following the Elo ranking system in chess. Mixtral - Instruct only ranks below proprietary models like OpenAI’s GPT-4, Google’s Bard and Anthropic’s Claude models, while being a significantly small model. This extremely strong performance of Mixtral - Instruct and with an open-source friendly Apache 2.0 license opens up the possibility for tremendous adoption of Mixtral for both commercial and non-commercial applications. It represents a much more powerful alternative to Llama 2 70B that is already being used as the foundational model for extending large language models to other languages like Hindi or Tamil that are spoken widely but not adequately represented in the training dataset of these large language models. 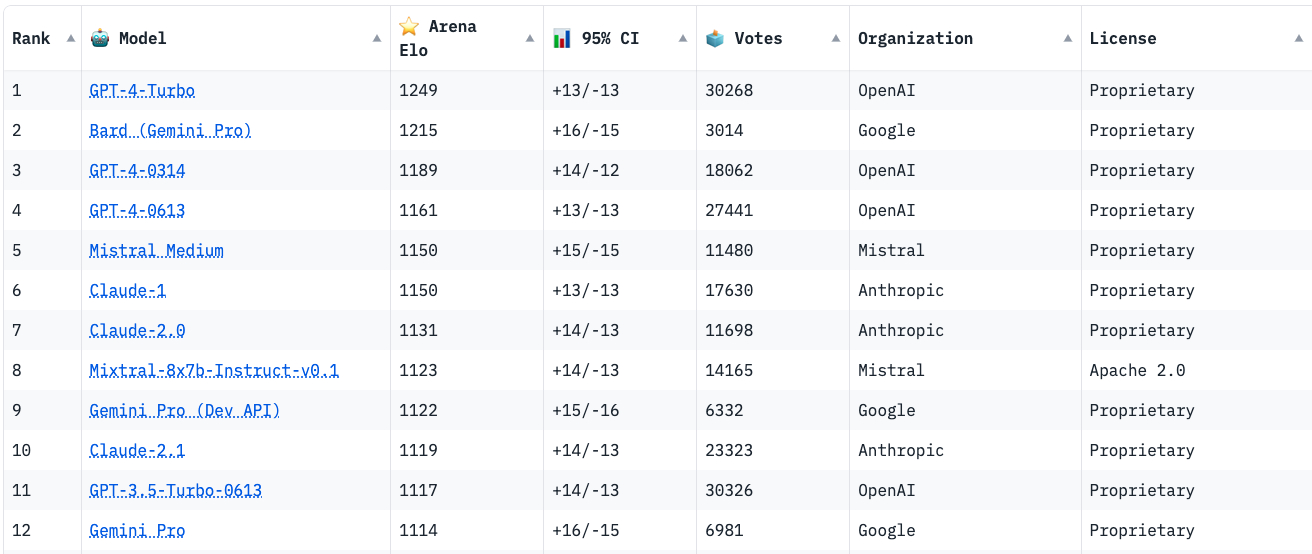 Figure 6. Mixtral is the best performing open-source large language model on the LMSys Leaderboard. 5. Use Cases
Mixtral represents the numero uno of open-source large language models as it clearly outperforms the previous best open-source model, Llama 2 70B, by a significant margin, while providing for faster and cheaper inference. At the time of writing this article, Mixtral has been available in the open-source for less than two months and we are yet to see many examples of how it is being used in the industry. However, there are some early movers, like the Brave browser that has already incorporated Mixtral in its AI-based browser assistant, Leo. Mixtral is also incorporated by Brave for powering its [programming-related queries in Brave Search. It is only a matter of time before Mixtral witnesses widespread adoption across industry for a variety of use cases and challenges the hegemony of proprietary models like OpenAI’s GPT-4 and the likes. 6. Conclusion Mixtral is a cutting-edge, mixture-of-experts model with state-of-the-art performance among open-source models. It consistently outperforms Llama 2 70B on a variety of benchmarks while having 5x fewer active parameters during inference. It thus allows for a faster, more accurate and cost-effective performance for diverse tasks including mathematics, code generation, as well as multilingual understanding. Mixtral - Instruct also outperforms proprietary models such as Gemini-Pro, Claude-2.1, GPT-3.5 Turbo on human evaluation benchmarks. Mixtral thus represents a powerful alternative to the much larger and more compute intensive Llama 2 70B as the de facto best open-source model, and will facilitate development of new methods and applications benefitting a wide variety of domains and industries. Published by Ikigai Labs Introduction
Many types of business data are organized in time—for instance, customer purchases on an e-commerce website or frequent orders of inventory materials by companies. Making sense of this time series data is vital for data or business analytics teams to understand the future dynamics of consumption and demand for their companies' products and services. Therefore, building predictive models to forecast demand is a vital task. There's a whole range of statistical as well as machine learning (ML) models that can be leveraged to build business-critical time series forecasting applications. However, time series data can be highly variable, and no one time series forecasting model will be applicable across use cases. With recent progress in ML and deep learning, new models are being developed all the time that provide state-of-the-art forecasting performance. For instance, Amazon has been working on a series of time series forecasting models over the last decade to predict customer demand for its products, ranging from statistical models to random forests to deep learning models, and transformers. Similarly, your business can benefit immensely from leveraging time series forecasting models to make accurate predictions of customer demand. In this article, you'll learn about ARIMA, Prophet, and mSSa, three popular time series forecasting models. These models have proved to be highly robust, reliable, easy to understand and implement, and versatile for forecasting applications in industries such as e-commerce, finance, retail, and travel. By the end of this article, you'll have a better sense of which of these models might be best for your own use case. Why Do Time Series Forecasting Models Matter? Real-world time series data have several characteristic patterns that reflect the nature of consumption and demand. For instance, if you're in the business of selling electronic gadgets, it's important for you to know how much inventory to stock so that you can meet the number of customer orders. Demand for your products can also change over time due to factors such as seasonal variations, holidays, the weather, or special events like the launch of a new product. Therefore, accurately forecasting the dynamics of demand becomes a critical function for your business. Poor demand forecasts may lead to grave consequences such as a significant reduction in sales and revenue as well as losing market share to your competitors. Using time series forecasting models enables your company to predict demand for the next day, week, month, or quarter and helps you to plan and prioritize business objectives and strategy accordingly. The time series forecasting models that have emerged over the years are based on different assumptions about the nature of the underlying time series data; as such, they've been developed to suit specific applications. To determine the time series forecasting model that's right for you, you should start by conducting preliminary analytics and evaluating the statistical distribution and properties of your data. This is an important step in identifying the right set of algorithms to model your specific time series data. Getting the choice right can help make your process more efficient without the need to test out multiple models. Once you've set a good baseline in terms of your model's performance, you can further improve it by experimenting with its various parameters. Additionally, the right model allows you to place more confidence in the accuracy of its results. Therefore, defining the most relevant time series forecasting model for your specific business use case is an important decision. Choosing between ARIMA, Prophet, and mSSa As mentioned, your particular use case is a key consideration. You may have large amounts of historical data that can be leveraged to make demand predictions for the next day, week, or month. Predicting electricity demand is one example that fits this scenario. Maybe you don't have a lot of historical data but still need to make forecasts for functions like sales or viewership or usage of a particular feature or product. In this section, you'll learn about the underlying principles of the ARIMA, Prophet, and mSSa time series forecasting models and be able to decide which models would be better suited to your forecasting goals. The ARIMA Model Autoregressive integrated moving average, or ARIMA, is a forecasting algorithm based on the assumption that past time series data can be used to predict future values. The amount of past information to use for modeling is controlled by a hyperparameter, p. ARIMA also assumes that past forecast errors can also be used to improve forecasts. The most recent errors are indexed by another hyperparameter, q. ARIMA models are great for forecasting stationary time series data. This implies that the data does not contain any seasonal or temporary trends and the statistical properties of the source of the time series data, like the mean and variance, do not change over time. A time series can be made stationary through several methods, with the common technique being differencing, where each differencing value is the difference between the value at the current time period and the previous time period. The number of differences required to achieve stationarity is determined by a hyperparameter, d. ARIMA is widely used for demand forecasting use cases, such as predicting demand in food manufacturing, energy, or user demand for services like ride-hailing. The Prophet Model Prophet is an open-source time series forecasting package developed by the data science team at Facebook. It's available in both Python and R and has been widely adopted across key industries such as e-commerce, tech, and finance. The forecasting algorithm is based on an additive model that can be decomposed into three distinct components: trends, seasonality, and holidays. As the forecasting model can be decomposed into its constituent factors, it's easy to extract the model coefficients to understand the relative impact of seasonality, trends, and holidays on the forecast. Prophet is best suited for forecasting applications that are associated with:
Prophet is designed to make forecasting automated and efficient for business analysts who may not have specialized data science skills. Its default parameters often yield forecasts that are as accurate as those produced by experienced forecasters. It's easy to use by nonexperts and requires less hyperparameter tuning. The mSSa model Multivariate singular spectrum analysis, or mSS, is a novel time series forecasting method that was recently formulated by scientists at MIT; they've shown that on benchmark data sets focused on time series data from electricity grids, traffic patterns, and financial markets, mSSa performs competitively with state-of-the-art neural networks for time series, such Amazon's DeepAR and LSTM. mSSa is particularly useful for modeling multiple time series with a varying number of observations per time series; it's also highly effective at imputation, or filling in missing values. mSSa has also been used to predict real-time traffic flow in software-defined networks with high levels of accuracy. Conclusion Forecasting demand is key for businesses to respond to fluctuating customer demand for their products and services. In this article, you learned about three popular time series forecasting models that are based on different statistical foundations: ARIMA, Prophet, and mSSa. These models have been used extensively at both startup and enterprise organizations, and you're now better equipped to choose which one could be right for you. Time series forecasting models can be built from scratch using libraries in R, Python, etc. Alternatively, for some organizations, it makes more sense to leverage existing platform solutions. For example, Ikigai provides a forecasting solution that includes all available algorithms including ARIMA, Prophet, mSSa, linear regression, etc., that can be easily configured using its no-code interface. When analysts are not sure which model to use, they can easily compare different ones with a one-click interface, or rely on AutoML to help them select the best model for their specific data. Additionally, Ikigai also provides a proprietary forecasting method called DeepCast that uniquely leverages statistical models with additional layers of machine learning on top of it, resulting in 20% more accurate forecasts vis-a-vis other state-of-the-art methods. Further, DeepCast is capable of making an accurate prediction based on only three weeks of data. Published by Pachyderm MLOps refers to the practice of delivering machine-learning models through repeatable and efficient workflows. It consists of a set of practices that focuses on various aspects of the machine-learning lifecycle, from the raw data to serving the model in production.
Despite the routine nature of many of these MLOps tasks, it’s not uncommon for several steps to still be processed manually, incurring massive ongoing maintenance costs. Your organization can benefit tremendously from automating MLOps to achieve efficiency, reliability, and cost-effectiveness at scale. For example, automation could:
However, many companies lack the capabilities, talent, and infrastructure to drive machine-learning models to production reliably and efficiently. This not only means wasted time and resources but also hinders adoption and trust in AI. The sooner that companies of any size, enterprise and startups alike, invest in automating their MLOps processes to expedite delivery of machine-learning models, the sooner they can meet their business goals. So, let’s talk about six methods for automating MLOps that can help streamline the continuous delivery of machine-learning models to production. 1. Automated Data-driven Pipelines Delivering a machine-learning model involves numerous steps, from processing the raw data to serving the model to production. Machine-learning pipelines consist of several connected components that can execute automatically in an independent and modular fashion. For instance, different pipelines can focus on data processing, model training, and model deployment. When it comes to machine learning, data is as or more important than code; pipelines track changes in training data and automatically trigger pipelines for processing new or changed data. Such automated data-driven pipelines kickstart further iterations of data processing and model training based on the new datasets. Without automated pipelines, the data science team executes these steps manually. This inevitably leads to manual errors, production delays, and lack of visibility of the overall pipeline for relevant stakeholders. Manually built pipelines are harder to troubleshoot when defects creep into production, and so compound technical debt for the MLOps team. Automating pipelines can significantly reduce manual effort and free up organizational time, resources, and bandwidth so your MLOps team can focus on other challenges. 2. Automated Version Control In the realm of software engineering, version control refers to the tracking of changes in code, making it easier to monitor, troubleshoot and collaborate among large teams. In machine learning, the need for version control applies to data as well as code. Version control is especially critical for machine-learning applications in domains like healthcare and finance that have a higher burden of model explainability, data privacy, and compliance. Automating version control for machine learning ensures that the history of the different moving parts—code, data, configurations, models, pipelines—is centrally maintained and fully automated. Through automated version control, your MLOps team has a more efficient ability to trace bugs, roll back changes that didn’t work, and collaborate with greater transparency and reliability. 3. Automated Deployment Large data science organizations develop multiple models trained on structured and unstructured data for various use cases. Some of these models need to make predictions in real-time at ultra-low latencies while others may be invoked less often or serve as inputs to other models. All these models need to be periodically retrained to improve performance and mitigate challenges due to data drift. Deploying models manually in such a complex business environment is highly inefficient and time consuming. Manual deployment is cumbersome and can cause serious errors that impacts model serving and the quality of model predictions. This often leads to poor customer experience and customer churn. Deployment of models to production involves several steps. It starts with choosing multiple environments and services for staging the model, selecting appropriate servers that can handle the production traffic, and pushing the model forward to production. It then includes monitoring model performance and data drift, automating model retraining with more recent data and inputs, and ensuring the reliability of the models through better testing and security. Automating these steps yields several benefits:
4. Automated Feature Selection for Model Training Classical machine-learning models are trained on data with hundreds to thousands of features, ie, key variables in the dataset that are often correlated with model performance. Choosing a set of features that significantly account for the predictive power of the trained models is therefore essential. Feature selection by hand is cumbersome and requires significant subject matter expertise. Automating feature selection not only helps train the machine-learning model faster on a smaller dataset but also makes the model easier to interpret. Selecting fewer features but with high feature importance is critical in the preparation of training data. Automated feature selection helps reduce the size of the model to make faster predictions, or to increase the speed of training your machine learning or deep learning model. Feature selection can be automated using either unsupervised learning techniques, like principal component analysis, or supervised methods using statistical tests like f-test, t-test, or chi-squared tests. 5. Automated Data Consistency Checks A central focus of data-centric AI is the quality of data used to train machine-learning models. Data quality determines the accuracy of the models, which in turn impacts business decision-making. So the underlying data must have minimal errors, inconsistencies, or missing values. Simplify the challenge of ensuring data quality and consistency by automating unit tests that check data types, expected values, missing cells, column and row names, and counts. Consider extending your automation to the analysis and reporting of the statistical properties of relevant features. If the training dataset consists of a few thousand to millions of samples and hundreds to thousands of features, you can’t manually evaluate every row and column for data consistency. Automated routines that test for different types of data inconsistencies makes it easier to eliminate poor quality data. 6. Automated Script Shortcuts Processing data and training machine-learning models involves a lot of boilerplate code. Automate the creation of scripts for common tasks to save time and effort while providing better visibility and version control. Typically, data scientists and machine-learning engineers create their own unique automations and shortcuts, which are seldom shared among the larger team. However, having a centralized repository of script shortcuts reduces the need to improvise, and perhaps even avoids a team member reinventing the wheel. Save these shortcuts as executable bash scripts for different use cases like downloading data from data lakes or uploading model artifacts in backup folders. Automate MLOps with Pachyderm Fortunately, you don’t have to build these MLOps automation features in-house from scratch. Pachyderm is a software platform that integrates with all the major cloud providers to continuously monitor changes in data at the level of individual files. Whenever any existing file is modified or new files are added to a training dataset, Pachyderm triggers events for pipelines and launches a new iteration of data transformation, testing data quality, or model training. Pachyderm can take care of automated version control and lineage for data as well as [deployment](https://www.pachyderm.com/events/how-to-build-a-robust-ml-workflow-with-pachyderm-and-seldon/. It also enables autoscaling and parallel processing on Kubernetes, orchestrating server resources for deployment at scale. Conclusion With a lot of the machine learning lifecycle still handled manually across the industry, consider automating any of the six MLOps tasks we covered here in order to achieve efficiency and reliability at scale:
A data science organization’s level of automation across its machine-learning lifecycle indicates its maturity. The velocity of training and delivering new machine-learning models to production increases significantly with that maturity, leading to faster realization of business impact. Pachyderm, a leading enterprise-grade data science platform, helps make explainable, repeatable, and scalable machine learning systems a reality. Its automated data pipeline and versioning tools can power complex data transformations for machine learning while remaining cost effective. Introduction
Data is the cornerstone of businesses from large enterprises to small D2C brands, and huge amounts of it can be collected from websites, mobile apps, chat messages, call centers, business transactions, surveys, and social media platforms, among other channels. All this data represents a gold mine of information that can offer customer insights and lead to new ideas for features or products. However, making sense of the data is easier said than done. The information originates from various channels and in multiple formats. It can be logged erroneously and contain other errors, including missing values. Because it comes from multiple domains, it can include unstructured data like text, images, audio, and video. That is why data preparation is essential. This involves cleaning, curating, transforming, and storing data sets for downstream applications including data analytics and data visualization, as well as predictive intelligence based on machine learning and deep learning models. Data can only provide value once it has been processed from its raw form, and effective data preparation can maximize that value. This article will explain the process of data preparation, especially in terms of data labeling, and will provide a checklist for data engineers to follow. What Is Data Preparation? Data preparation is not an entirely new process in technology companies. Data-driven operations previously focused on statistical analysis of business data from structured tables. The deep learning model has grown over the past decade along with the global penetration of mobile phones, widely available internet access, and cheaper cloud storage facilities. Today an estimated 2.5 quintillion bytes of data are being generated daily. Every user interaction with online companies is recorded, from someone clicking an ad or adding a product to a shopping cart to sharing a photo on a social media app. User-generated data is generally unstructured data: images, text, audio, or video. Such data can be used to train sophisticated deep learning models to predict what users want to type in a text, which branded products are featured in an image, and what kind of customer service will be provided in a phone conversation. For deep learning models to make sense of this data, all data samples need to be labeled. Data labeling tells the machine learning models what knowledge they need to acquire via supervised learning to power smart applications. This makes labeling critical in preparing data sets for training machine learning models. However, data labeling can also represent the chief source of errors, affecting potential improvement in model performance. Machine learning models can only be as accurate as the labeled data, which represents the models’ entire knowledge for the particular use case. For example, the source image data set in a face recognition program requires a label for every face shown in every image. During the labeling process for this data set, every image is reviewed by human subject matter experts, crowdsourced labelers on platforms like Amazon Mechanical Turk, or algorithms. Labeling helps clean and prepare the data set by removing noisy or unusable data. In this case, images that don’t contain any faces, or that show unreadable faces due to poor lighting or angles, should be removed because they won’t be helpful in training a face recognition model. This step also ensures the inclusion of images that are most helpful for the desired use case. Once the data set is reviewed and annotated, it can be used for all subsequent face recognition applications instead of going back to the raw data set. This saves time and effort for data engineers, as well as data scientists who might build novel models using the same data set. Additionally, multiple labels and metadata can be applied to each image during the labeling process so that they’re available for new use cases. A tag that identifies the face as that of a man, woman, or child can be used for different computer vision applications. This can potentially give the data set more flexibility for the future. The labeling can be built upon in subsequent versions of the data set. Once the face recognition model is live in production, new images can be labeled to help the model overcome data drift and augment its performance in the face of changing data distributions. This continued labeling and organizing keeps the models more robust and consistent. Data Preparation Steps There are certain best practices to follow when preparing data sets for deep learning applications. Following is a checklist for data engineers when working with unstructured data: (1) Check data formats Samples in a data set, especially if collected via web scraping or crowdsourcing, may come in multiple data formats. For example, an image could be a JPEG, PNG, or TIFF, while an audio file could be a WAV, MP3, or FLAC. Check whether the data set samples are in different formats, so that you can standardize the format across all samples. (2) Verify data types Certain deep learning applications are based on multimodal data including text, images, audio, video, and structured metadata. For example, a model that predicts what video a user might watch next is trained using multiple data types. It verifies the type of each data sample, then indexes and stores them separately. Note that an individual data type like numbers might also belong to different types like int, float, or string. (3) Verify data dimensions It’s crucial to check the dimensionality of the samples in a data set. For example, a set of images containing faces may be gathered from different cameras, each associated with different default image dimensions. (4) Identify what data needs to be labeled Once you’ve completed the above steps, you can begin data labeling. It may not be feasible in some situations to label each data sample, because manual labeling can be prohibitively expensive and time-consuming. In this case, choose an appropriate number of data samples for labeling. For common machine learning classification use cases, you need to sample data for labeling from each category. (5) Determine what type of labeling to perform The same data sample can be labeled in multiple ways depending on the use case. For instance, an image containing people and cars may be labeled for faces, for segmenting people or cars, or for the vehicle registration plates. (6) Decide who will label the data Data labeling can be performed manually by domain experts, crowdsourced from non-experts, or done programmatically using rule-based or model-based algorithms. Determine which annotators will define what kind of data, depending on their expertise or level of training. If a data set will be labeled using software, then the required configuration parameters, protocols, and performance metrics need to be established so that labeling is consistent. (7) Review data for errors and mistakes Usually, the first round of data labeling contains errors. To improve the data quality and eradicate errors, more experienced annotators should conduct a second or third level of review. Depending on cost, time, and available resources, each data sample can also be independently labeled by multiple annotators; the most commonly provided label can be assigned as the final label. (8) Split the data set into training and testing segments Once a data set is labeled, split it into separate train and test subsets for training and evaluating the model, respectively. Depending on the use case and the amount of available data, the ratio might be 80:20, 90:10, or even 99:1. To obtain more reliable results, k-fold cross-validation is recommended. Multiple training and test sets are sampled randomly, and the final results are averaged across all the different folds. Conclusion Without the protection of systematic data preparation and labeling checks, you may find that poor quality data damages the accuracy and performance of any analysis or models based on that data. If you follow the above guide, you will be able to ensure your data is good quality and labeled accurately. Related Blogs
Introduction Metrics are widely used by data, product, strategy, and business teams to capture and summarize data about various aspects of user behavior, product performance, and the health of the business. Metrics like annual recurring revenue (ARR), gross merchandise volume (GMV), customer acquisition cost (CAC), lifetime value (LTV), and net promoter score (NPS) are common parlance in product startups and large tech companies. Technical and business stakeholders need the information collected in metrics to make sense of their product and business performance so that they can make data-driven decisions. This makes tracking metrics essential to detect potential issues, plan new business initiatives, ensure growth, and share pertinent information with regulatory bodies as well as shareholders. A change in growth metrics can deeply impact investor confidence and the perception of the company in public markets. For instance, the stock prices of Meta and Netflix recently plummeted after they reported declines in key growth metrics like daily active users (DAU) and number of subscribers, respectively. For tech companies at this scale, staying on top of metrics is critical and requires a sophisticated approach to data engineering, data governance, and data democratization. In this article, you’ll learn about how metrics are defined, used, and managed at different types of large tech companies. How Do Large Companies Define and Use Metrics? Though large companies are equally reliant on metrics to drive their decision-making, what they measure and how they measure it will vary by company. The following are examples of the metrics strategies used at Uber, Airbnb, Spotify, and Netflix. Uber Uber’s core business is a marketplace that connects riders with drivers in real time at a global scale. Its product teams rely most heavily on metrics related to trips taken and driver experience, such as “driver acceptance rate” and “completed trips.” It also uses map data to determine driver ETA and pickup and dropoff spots. Because disparate versions of the same metrics were being used across business teams, leading to ineffective and poor decision-making, Uber implemented changes to improve metric standardization. The company built a unified metric platform called uMetric to enforce a strict one-to-one mapping from business logic to metrics without any discrepancies. uMetric is built on engineering solutions that democratize data and provide a clear understanding of the entire metric lifecycle so that the data can be better used in machine learning models. The platform enables access to metrics across their entire lifecycle, from definition, discovery, and planning to computation, quality, and consumption. Clear and unambiguous definition of metrics is a key pillar of the platform, and metrics can be defined by any author without any duplication. In uMetric, a metrics definition model is designed on the following core principles:
Using this definition model is not enough to ensure metric standardization, however. Additional policies and solutions focused on data governance, data quality, and access control are necessary to scale the platform across the company. Airbnb Similar to Uber, the vacation rental marketplace Airbnb built a metrics platform called Minerva to achieve metric consistency and serve as the ground truth for data analytics, reporting, and experimentation. Airbnb built its foundation of data on lodgings and vacation rentals on tables referred to as `core_data`. As the company grew, though, teams built separate tables on top of `core_data` without any information about data lineage or correspondence between these tables. This led to conflicting results and insights, which confounded data-driven decision-makers. Minerva was designed to solve these problems. It takes facts and dimension tables as inputs, optimizes the data through denormalization, then sends the data to downstream applications. Minerva acts as the metric store for more than 30,000 metrics produced by more than 200 stakeholders across the organization. As uMetric does, Minerva supports the end-to-end lifecycle of a metric from definition to deprecation and powers the whole tech stack of Airbnb. Metrics, dimensions, and metadata are defined and stored in a central GitHub repository that is accessible by any stakeholder in the company. Once defined, metrics can be used anywhere via dashboarding tools or A/B experimentation frameworks. All the metrics defined in Minerva are indexed in Dataportal, Airbnb’s internal data catalog. A deeper dive into the metrics is facilitated by another tool called Metric Explorer, which is designed for both technical and non-technical users. Minerva powers several downstream applications:
Spotify The Spotify global audio streaming service also developed an in-house metrics catalog, but as part of a modern A/B testing experimentation platform in order to create custom metrics at scale. Spotify’s metrics catalog runs SQL pipelines to ingest metrics into a data warehouse. This enables the collected metrics to be almost instantly stored, managed, and served to the experimentation platform. A key feature of the metrics catalog is that it enables self-service. Teams can write SQL queries to define metrics, and the rest is taken care of by the managed system. To address the problem of lack of metrics standardization and metrics duplication, Spotify built a Metrics Hub. In addition to providing a single source of truth, the hub also focused on creating symmetry between offline and online use of metrics. This feature makes it easy to take any metric definition and deploy it seamlessly in different environments to power experimentation and machine learning use cases. In typical A/B testing experiments, users are split into distinct groups. Consider a hypothetical example in which Spotify wants to A/B test whether podcasts are more popular in the 30- to 39-year age group or the 20- to 29-year age group. This experiment requires a set of user-level input metrics like demographics, daily or weekly listening time, number of songs listened to, and number of podcasts listened to. Spotify’s metric pipeline integrates these metrics with the experimental group each user belongs to. This data is combined and stored in a data warehouse, then accessed with an API that allows users to query data without needing to understand the underlying storage. A metrics catalog enables multiple stakeholders to access and analyze data, which helps an organization to more efficiently and quickly improve the customer experience. Netflix As a global entertainment platform that serves real-time video content to millions of users, Netflix needs to mine numerous insights on metrics like user engagement, viewership, and video streaming quality. It uses the data it gathers to make recommendations to users based on factors like watch history and demographics. Netflix powers multiple experiments in parallel through a centralized A/B experimentation platform. Similar to Spotify, this platform has a metrics catalog at its core. A centralized metrics repository built using Python, Metrics Repo is home to diverse user-level as well as technical metrics like streaming time, play delay, and retention rate. Metrics Repo provides a unified platform for metric definitions that are typically defined and engineered differently by various business teams. In this modular architecture, data scientists can add metric definitions directly and join data tables to perform metric computations. Analytical reports can be calculated on demand without affecting the underlying metrics. Metrics Repo serves as a single source of truth for statistical analysis and causal inference based on these metrics and visualization of corresponding results and insights. This architecture provides a transparent metric lineage and definition, ensuring greater trust in the experimental results. This is critical for enabling rapid mining of insights, development of new products and strategies, and executive-level decision-making. Conclusion Metrics provide a data-driven summary of key business goals and operational performance. Product managers, data analysts, and business leaders use them to assess and track the growth of the business, as well as devise new products and strategies. Because metrics are so crucial to the health and growth of a business, stakeholders need a clearly defined way to collect and measure metrics in order to improve their decision-making. You’ve learned about how data teams define and use metrics at four top tech companies: Uber, Airbnb, Spotify, and Netflix. Uber and Airbnb built an internal metrics platform that manages the entire lifecycle of their metrics. Spotify and Netflix, meanwhile, built metrics catalogs to form a central pillar of a modular and scalable experimentation platform. These different solutions achieve the same goal of making necessary data cohesive, consistent, and actionable. Related Blogs
Published by Andela Introduction
Data culture refers to an organizational culture of using data to derive insights and make informed business decisions. Companies can build a strong data culture by arming themselves with data and the right set of people, policies, and technologies. A data culture helps companies become more competitive and resourceful by leveraging data. And data-driven companies make better, faster, and more objective business decisions. They promote greater employee engagement and retention, and drive better financial outcomes in terms of revenue, profitability, and operational efficiency. In this article, you'll learn about data culture, what its importance is for modern organizations, and how you can build a strong data culture at your company. Why You Need a Strong Data Culture? Without a solid data culture, organizations will inevitably fail to harness the power of data. As previously stated, data culture refers to a set of beliefs and practices that companies use to cultivate and drive more data-driven decisions. Traditionally, businesses relied on the instinct and gut of a select few leaders to make strategic business decisions. However, with the accumulation and collection of massive volumes of customer and business data, domain expertise and instinct can now be complemented with data-driven insights to make more informed decisions. There are several advantages to building a strong data culture. Some of these include the following:
Every business sector, from product to finance to HR, creates and collects a lot of data from external customers or internal operations. For business heads and decision-makers, it's no longer feasible to stay on top of the ever-increasing volumes of data to better understand and evaluate the current state of their organization. However, with data analysts and scientists embedded across each department, it is possible to tap business insights in real time and respond quickly to changes in business performance. A strong data culture also promotes greater employee engagement and retention. When employees see that decisions are made on the basis of data and not driven just by the highest-paid executives, they feel that they can contribute more insights to influence decision-making. In the long term, this facilitates attracting the best talent in the market who can be incentivized to have a greater say in making key business decisions using data. Moreover, there are also strong financial outcomes associated with building and promoting a data culture. Companies with data-driven cultures benefit from increased revenue, better customer services, and more operational efficiencies leading to improved profitability. How to Build a Strong Data Culture? Building a strong data culture is a long-term endeavor that requires patient support and encouragement from leadership. Companies with strong data-driven cultures have executives who lead by example and establish clear expectations that decisions will be objective and based on data. Data leaders can lead from the front by establishing clear goals and guidelines, investing in technology and training, as well as identifying and rewarding employee behaviors that embody a data-led culture. Beyond leadership setting a tone for the whole organization, let's take a look at a few other components that can help build a strong data culture. 1 Bring Business and Data Science Together One of the first steps in building a data culture is to build a strong data science team consisting of data analysts, data engineers, and data scientists. Having quality in-house data talent is a competitive advantage that reaps multiple benefits, including building a robust culture focused on data. Once a data science team is up and running, it needs to be strategically embedded across various departments of the business. This helps business professionals interact with data professionals more regularly and better understand how the power of data analytics and data science can improve business efficiencies and impact profitability and growth. At the same time, this setting enables data professionals to better understand how the business works and build intuition for developing better data and machine learning–powered tools and products. This creates a positive flywheel where both business and data science teams learn to collaborate better and benefit from their respective skill sets. By bringing business and data science together, everyone in the organization learns to appreciate the value of data and use data-driven insights to improve the quality of their decisions, products, and services. 2 Leverage Data When Creating Goals and Deadlines Driving strategic business goals and metrics by leveraging data is a key aspect of encouraging a data-led culture. When goal-setting exercises are conducted objectively and leaders regularly use data and metrics from previous business quarters or external data about competitors or the overall market, everyone in the organization will start to embrace similar data-driven approaches. Leveraging data for setting new targets also enables every stakeholder in the organization to understand and anticipate their future goals and prioritize their work accordingly. Data-led goal setting is a more democratic and fair-minded process that encourages ownership of respective goals by every employee, as opposed to arbitrary, instinct-led, unilateral decisions made by the leadership. 3 Ensure Everybody Has Access to Data A fundamental step toward attaining a data culture is to democratize access to data across the organization. Data culture is a difficult goal when employees in different parts of a business struggle to obtain data. If you don't give your employees access to your data, they won't be able to utilize it when making decisions. This disenfranchises the data analysts, engineers, and scientists disproportionately, as their day-to-day work is impacted the most. Without a motivated team of data professionals, the downstream benefits of data are unlikely to materialize across various business departments. A strong foundation of data governance and data democratization is a prerequisite to achieving the business goals associated with a robust data culture. 4 Keep Your Data Technology Up-to-Date A critical aspect of building a data culture is employing modern tools and technologies to make it easier for employees to access, analyze, and share data-driven insights. Building a modern data stack with newer components like a metrics layer simplifies data-based operations and analytics for everyone, especially nontechnical business stakeholders. Technology, like data warehouses and metrics layers; data analytics tools, like Tableau or Power BI; and customer relationship management (CRM) tools, like Salesforce, are indispensable for modern businesses. Building the data architecture in a cloud environment like Amazon Web Services further improves access to data and reduces the need for multiple tools with a steep learning curve. The right use of tools for data, collaboration, and customer service goes a long way in fostering the use of technology to drive a strong data-led culture. 5 Provide Training for Employees Having supportive leadership and access to data and technology is of little use if employees are not data literate and able to extract insights from data. This requires further investment in terms of learning and development to empower employees with the necessary skills to explore, understand, and share data-driven insights across the organization. In addition to reducing the skills gap, it also encourages people from nontechnical backgrounds to become more data savvy, collaborate better with data experts, and build more comprehensive data products and solutions to benefit the business. 6 Reward Data-Oriented Decisions and Behavior The primary challenge to becoming a data-driven organization is not technical but cultural. A strong data culture is based on a robust foundation of people, policies, and technology. However, once the initial foundation is in place, data leaders need to maintain and bolster the spirit of data-driven decision-making by incentivizing and rewarding behaviors that embody the culture. At the same time, decisions and behaviors that do not represent a holistic data-led process ought to be called out and questioned until every single employee is on board with the philosophy of using data for every decision. This includes encouraging experimentation to answer key business questions for which data does not exist yet or when the current set of data does not yield compelling evidence. Conclusion In this article, you learned about the importance of a data culture for businesses. It's a formidable task to build a strong data culture and is a top priority for a majority of CEOs. Data-driven companies are in a better position to attract and retain talent, make faster decisions with more conviction, and drive stronger growth and profitability to meet their business goals. According to research by McKinsey & Company, data-driven companies are able to achieve their goals faster and realize at least 20 percent more earnings. Related Blogs Introduction
Today, data is at the core of many companies, and it's of the highest importance for running a successful business. Companies process huge amounts of data daily, which they must store, categorize, track, and organize by cataloging, and that's where data governance comes in. Data governance is a set of processes that promote better management of business data, unlocking the true value of data by ensuring that it's more accessible, reliable, secure, and compliant. For modern data-driven organizations, a strong data governance framework is not only important but essential for the best use of data in business decisions. A strong data governance framework usually encompasses functions such as managing data access and data ownership, tracing data lineage, managing duplicate or false data, and classifying and assuring data quality. All of these are the pillars of a successful data governance process. However, implementing a robust data governance framework is no small feat. If not done systematically, it can lead to a huge loss of organizational time, resources, and effort. Companies that have made significant progress in building data governance frameworks and cultivated a strong and inclusive data culture have done so incrementally, aligning incentives and creating deep collaboration across cross-functional teams that own the data governance roadmap. Organizations are more likely to be successful if they can bring together people, processes, and technology to build their framework. In this article, you'll learn about best practices for implementing data governance in an organization. Companies can leverage existing best practices and build on them to fast-track their own data governance efforts. What Are the Challenges of Implementing Data Governance? Before you plan your data governance strategy, you need to look out for some common challenges. One major challenge for organizations is building a strong business use case for investing staff and resources in a data governance framework. Those that haven't yet embraced digital transformation and the better, faster decision-making possible with deeper data analysis might not see the long-term business value of data governance. It's important to unite relevant stakeholders across the organization to take on the challenge. Even when organizations do launch a governance framework, they may fail to achieve its true potential. Poor data leadership and ownership may be an obstacle, for example. Data governance also requires collaboration and consistent enforcement across departments to succeed. For example, the finance department could collaborate with the accountancy department to create a cross-practice team to communicate and transfer data more transparently. So, without the buy-in and blessings of the tech and collaborative data ownership that helps break down the organizational silos, the program is unlikely to come to fruition. Additionally, a good data governance framework relies on high-quality data. The primary goal of data governance is to make data more accessible, secure, and reliable for stakeholders to consume for their own use cases. However, if the quality of the data at the source is poor, implementing data governance becomes much more difficult. Data Governance Best Practices The following are best practices that have been adopted successfully by numerous organizations, such as Collibra, IBM, Informatica, Select Star, and more, in building comprehensive data governance frameworks. 1 Build a Strong Business Use Case The goal of data governance is to enable every stakeholder to use the data to make business decisions relevant to their department, whether that's sales, marketing, finance, or human resources. This means that you need the support and alignment of all users and departments right from the beginning. Without cross-functional support, building a strong business case for investing in a long-term mission like data governance is less likely to succeed. Data governance generates some significant business benefits that can make the advantages of the process clear to the leadership. It saves time and provides improved security and reliable and more accurate data, making it easier to make data-driven decisions. When these business benefits are made clear to the leadership, it's easier to get approval for needed staff, budget, and resources for the project. 2 Identify Data Stewards and Owners Clearly defined roles and owners are necessary to build the data governance framework in a structured manner. Knowing which stakeholders own certain responsibilities also helps with clear lines of communication. Exact roles may differ across organizations, but the following are common choices:
3 Start Small Creating a strong data governance framework requires the right mix of people, processes, and technology to come together. It's crucial to start small and aim for quick incremental wins rather than overpromising and underdelivering. Creating governance guidelines requires specific expertise; you could hire this expertise, but empowering and upskilling people within your existing team might be more successful as they already know your data. Those responsible for data governance then need to gradually build trust and seek alignment from various cross-functional departments before the framework policies can be enshrined as organization-wide processes. For governance-based processes to be adopted and diligently followed, your data stewards need to implement regular checks and audits and guide team members and departments that might not be familiar with good data governance practices. This guidance has two dimensions: cultural guidance and technological guidance concerning the required tools. When data stewards implement processes, they should also implement the right tools for advanced actions such as automation. Once every cross-functional team understands when and how to use governance principles in their day-to-day work with the help of the tools, you can automate some of the processes. 4 Define and Measure Metrics Data governance is a long-term investment. However, it's important to measure progress in smaller time frames to ensure that key milestones are being achieved without any delays or hurdles. Monitoring some metrics, such as the percentage of the data assets per ownership, the number of questions or errors that are reported to the data team, or the number of dashboards that are being used across the organization and their types, might help achieve those key milestones in the long term. In other words, a clear roadmap with specified deliverables, timelines, and metrics that are shared among all the owners ensures that progress can be evaluated in achievable, measurable steps. You need to be able to periodically check the progress of your governance framework to ensure that it's still on track. This image shows a detailed roadmap for establishing a data governance program over a period of two years. Individual tasks can be defined for each business quarter and for different aspects of the framework, such as data insights, data quality, data standards, and data governance and management. For example, improving data quality can be broken down into multiple milestones per business quarter. The goal for the first quarter may be hiring a data engineering team, while the next quarters may focus on establishing reference data repositories, data cleaning, and building data stores and data warehouses. This structured approach keeps cross-functional teams informed on the overall plan and ensures continued progress. 5 Establish Strong Communication Channels Frequent and effective communication is the key to aligning stakeholders and collaborating across teams. Everyone should understand the desired goals and keep others informed on their progress in implementing them. Additionally, your data stewards must be as transparent as possible to earn trust across the organization and emphasize the impact of investment in data governance to the executive leadership as well as to the downstream users of the framework. They can create a single channel for communication, which is like a linked data catalog where you can search data assets or collaborate on them. This way of communication is pivotal both during the implementation phase and after the framework is established. A single channel for communication will help drive strong adoption rates, resolve queries, and allow you to share updates to the governance policies as data and compliance requirements evolve. 6 Contextualize Data Data contextualization involves adding any relevant information to data to make it actionable. Contextualization provides users better interpretation of the data and enables organizations to make smarter decisions. This helps a data governance process work more efficiently as contextualized data has clearer meanings and allows decision makers to have enriched information regarding the actions they should take. Moreover, it can help improve how the organization handles data in its data governance environment. 7 Build a Long-Term Strategy for Data Governance Achieving a strong data governance framework can be a moving target. You need to ensure that stakeholders know this is a long-term investment. Data governance is a continuous process that consists of many smaller projects and deliverables. Ramping up speed and complexity over time helps to scale your efforts. While the overall framework may take several years, smaller milestones can be set and achieved over shorter time frames, like a business quarter. For instance, a useful set of milestones to accomplish in the first quarter of working on a data governance framework may include establishing data management policies and standards, hiring a data engineering team, and drafting a data management strategy together with all relevant stakeholders. As long as they see incremental progress, stakeholders will learn to trust the process and be invested in the success of the project. 8 Expose the Data through Documentation Knowing exactly what your data represents is a critical component of data governance. Users should have a single, centralized platform where they can find documentation related to their data. This documentation should be continuously updated, reviewed, and revised and should also be directly tied to the actual data assets. These actions will ensure that your users can trust and rely on your documentation, as it will always be up to date and accurate. Strong data governance should expose the data through process-oriented documentation that is directly connected to the data. 9 Data Lineage and Usage Knowing the source of data, where your data is flowing, and who is accessing it is important. With data governance, you have to build trust in your data, ensure the data is used properly in your organization, and troubleshoot issues when they arise. Data lineage helps automatically identify sensitive information and propagate some data governance-related policies. Data lineage also informs reports, issue logs, and audit logs, which show that the data governance requirements are met. As an example, data lineage prevents teams from using a dashboard that was supposed to be deprecated or two different business units from building a metric using different underlying data. Successful Data Governance Frameworks Several large global companies have successfully implemented data governance frameworks. The following are some examples. PwC, a global professional services company, has created a data governance framework consisting of the following components:
ING, a Dutch multinational banking and financial services corporation, leveraged IBM Cloud Pak to improve data governance for its users in a hybrid cloud environment. There are also several third-party companies that assist larger organizations with their data governance strategy and implementation, such as Collibra, Informatica, and Alation, and data catalogs that provide tools and insights required for implementing a data governance practice on your own, such as Select Star and Atlan. Outcomes of a Strong Data Governance Implementing a strong data governance strategy will inevitably lead to outcomes such as improved data quality, decreased data management costs, and better data analytics, which, in turn, leads to better decision-making throughout the organization. The following list provides an overview of the outcomes of effective data governance:
For an organization, the time it takes to achieve these outcomes is closely related to the strength of its data governance implementation processes. Over time, these all contribute to one overarching outcome: organizational success. Conclusion Data governance is an essential requirement for modern organizations to drive greater adoption of data and empower business decision-making. Organizations can find it difficult to extract the full value of their data assets, especially as the amount of data keeps growing. Data governance frameworks lay down clear policies and guidelines for improving the quality of data and democratizing its usage across a business. If you can navigate the challenges involved and follow the above best practices in creating and implementing your data governance framework, you can accelerate your organization's understanding and usage of data and deliver data-driven decision-making to your organization. Related Blogs
Introduction
Traditional machine learning is based on training models on data sets that are stored in a centralized location like an on-premise server or cloud storage. For domains like healthcare, privacy and compliance issues complicate the collection, storage, and sharing of critical patient and medical data. This poses a considerable challenge for building machine learning models for healthcare. Federated learning is a technique that enables collaborative machine learning without the need for centralized training data. A shared machine learning model is trained by keeping all the training data on a device, thereby ensuring higher levels of privacy and security compared to the traditional machine learning setup where data is stored in the cloud. This technique is especially useful in domains with high security and privacy constraints like healthcare, finance, or governance. Users benefit from the power of personalized machine learning models without compromising their sensitive data. This article describes federated learning and its various applications with a special focus on healthcare. How Does Federated Learning Work? This section discusses in detail how federated learning works for a hypothetical use case of a number of healthcare institutions working collaboratively to build a deep learning model to analyze MRI scans. In a typical federated learning setup, there’s a centralized server, for instance, in the cloud, that interacts with multiple sources of training data, such as hospitals in this example. The centralized server houses a global deep learning model for the specific use case that is copied to each hospital to train on its own data set. Each hospital in this setup trains the global deep learning model locally for a few iterations on its internal data set and sends the updated version of the model back to the centralized server. Each model update is then sent to the cloud server using encrypted communication protocols, where it’s averaged with the updates from other hospitals to improve the shared global model. The updated parameters are then shared with the participating hospitals so that they can continue local training. In this fashion, the global model can learn the intricacies of the diverse data sets stored across various partner hospitals and become more robust and accurate. At the same time, the collaborating hospitals never have to send their confidential patient data outside their premises, which helps ensure that they don’t violate strict regulatory requirements like HIPAA. The data from each hospital is secured within its own infrastructure. This unique federated learning setup is easily scalable and can accommodate new partner hospitals; it also remains unaffected if any of the existing partners decide to exit the arrangement. Use Cases for Federated Learning in Healthcare Federated learning has immense potential across many industries, including mobile applications, healthcare, and digital health. It has already been used successfully for healthcare applications, including health data management, remote health monitoring, medical imaging, and COVID-19 detection. As an example of its use for mobile applications, Google used this technique to improve Smart Text Selection on Android mobile phones. In this use case, it enables users to select, copy, and use text quickly by predicting the desired word or sequence of words based on user input. Each time a user taps to select a piece of text and corrects the model’s suggestion, the global model receives precise feedback that’s used to improve the model. Federated learning is also relevant for autonomous vehicles to improve real-time decision-making and real-time data collection about traffic and roads. Self-driving cars require real-time updates, and the above types of information can be effectively pooled from several vehicles in real time using federated learning. Privacy and Security With increased focus on data privacy laws from governments and regulatory bodies, protecting user data is of utmost importance. Many companies store customer data, including personally identifiable information such as names, addresses, mobile numbers, email addresses, etc. Apart from these static data types, user interactions with companies such as chat, emails, and phone calls also carry sensitive details that need to be protected from hackers and malicious attacks. Privacy-enhancing technologies like differential privacy, homomorphic encryption, and Many startups and large tech companies are investing heavily in privacy technologies like federated learning to ensure that customers have a pleasant user experience without their personal data being compromised. In the healthcare industry, federated learning is a promising technology that allows, for example, hospitals to share electronic health records (EHR) to create more accurate models. Privacy is preserved without violating strict HIPAA standards by decentralizing the data processing, which is distributed among multiple end-points instead of being managed from a central server. Simply put, federated learning allows training of machine learning models without the need to collect raw data in a central location; instead, the data used by each end-point (in this example, hospitals) remains local. By combining the above with differential privacy, hospitals can even provide a quantifiable measure of data anonymization. Federated Learning vs. Distributed Learning and Edge Computing Federated learning is often confused with distributed learning. In the context of deep learning, distributed training is used to train large, deep neural networks across a number of GPUs or machines. However, distributed learning relies on centralized training data shared across multiple nodes to increase the speed of model training. Federated learning, on the other hand, is based on decentralized data stored across a number of devices and produces a central, aggregate model. A fascinating example of the potential of this technology is using federated learning-based Person Movement Identification (PMI) through wearable devices for smart healthcare systems. Edge computing is a related concept where the data and model are centralized in the same individual device. Edge computing doesn’t train models that learn from data stored across multiple devices, as in the case of federated learning. Instead, a centrally trained model is deployed on an edge device, where it runs on data collected from that device. For example, edge computing is applied in the context of Amazon Alexa devices, where a wake word detection model is stored on the device to detect every utterance of “Alexa.” AI and Healthcare Federated machine learning has a strong appeal for healthcare applications. By design, patient and medical data is highly regulated and needs to adhere to strict security and privacy standards. By collating data from participating healthcare institutions, organizations can ensure that confidential patient data doesn’t leave their ecosystem; they can also benefit from machine learning models trained on data across a number of healthcare institutions. Large hospital networks can now work together and pool their data to build AI models for a variety of medical use cases. With federated learning, smaller community and rural hospitals with fewer resources and lower budgets can also benefit and provide better health outcomes to more of the population. This technique also helps to capture a greater variety of patient traits, including variations in age, gender, and ethnicity, which may vary significantly from one geographic region to another. Machine learning models based on such diverse data sets are likely to be less biased and more likely to produce more accurate results. In turn, the expert feedback of trained medical professionals can help to further improve the accuracy of the various AI models. Federated learning, therefore, has the potential to introduce massive innovations and discoveries in the healthcare industry and bring novel AI-driven applications to market and patients faster. Conclusion Federated learning enables secure, private, and collaborative machine learning where the training data doesn’t leave the user device or organizational infrastructure. It harnesses diverse data from various sources and produces an aggregate model that’s more accurate. This technique has introduced significant improvements in information sharing and increased the efficacy of collaborative machine learning between hospitals. It circumvents and overcomes the challenges of working with highly sensitive medical data while leveraging the power of state-of-the-art machine learning and deep learning. Related Blogs

Web3 is the third generation of the internet based on emerging technologies like blockchains, tokens, DAOs, digital assets, decentralised finance that has the potential to give back control of digital assets back to the users with greater trust and transparency.
Typical web3 applications focus on DAOs, DeFi, Stablecoins, Privacy and digital infrastructure, the creator economy amongst others. The web3 ecosystem represents a promising green space for creators, developers, and various types of tech and non-tech professionals as well. In my talk (video and slides shared above) for Crater's Encrypt 2022 hackathon, I describe how AI can be leveraged to build commercially viable web3 applications for India. I cover a number of relevant AI/ML datasets, models, resources and applications for these domains, recognized by the Ministry of Electronics and Information Technology's National Strategy on Blockchain:
Related Blogs Published by Andela Introduction
Modern tech companies realize that data teams need to consist of professionals with varied expertise, including data analysts, data engineers, data scientists, applied scientists, and machine learning engineers. Data teams work closely with cross-functional stakeholders to build data-driven products that are powered by predictive analytics as well as machine learning. Data-driven organizations rely on robust data infrastructure and ETL processes for downstream machine learning use cases. This recent development is accompanied by the rise of data engineering as a specialized discipline. As more organizations undergo digital and AI transformation journeys, the demand for data engineers has increased concomitantly. Data engineers are required to build the data infrastructure and pipelines and facilitate easy access to processed data for data scientists to build machine learning models. In this article, we’ll dive into the differences between the profiles of a data engineer and a data scientist along several dimensions, including their roles and responsibilities, educational requirements, specializations, and career growth. Roles and responsibilities of data engineers and data scientists Data engineers primarily build the pipeline system for data scientists to consume with models for various use cases. Therefore, data engineers are often hired earlier to build the data platform before onboarding data scientists. In smaller companies and startups, it is not uncommon for data professionals to do both data engineering and data science. As a company grows and scales its data science efforts, specialized data engineering and data science professionals become necessary. Data engineer’s responsibilities
Data scientist’s responsibilities
Every day, data engineers usually write code, build data pipelines, and maintain various pieces of the data infrastructure as well as serve requests for cleaned and processed data from data scientists. Data scientists typically spend most of the day developing and training machine learning models, conducting multiple experiments to optimize the model performance, and meeting cross-functional stakeholders from engineering, product, and business teams to discuss results and develop new use cases. Education differences between data engineers and data scientists Data engineers typically have a bachelor’s degree in computer science or information technology. Their core expertise is focused on software engineering skills such as programming, algorithms, data structures, systems architecture, and building software tools. With the advent of cloud computing as the foundation for any tech organization, data engineers are also expected to be familiar with relevant cloud-based technologies (like AWS, Microsoft Azure, and Google Cloud Platform) focused on data warehousing, data visualization, and data analytics. Similarly, data scientists are also able to leverage cloud-based machine learning services and APIs for common use cases such as recommender systems, computer vision, and NLP, instead of starting from scratch. Certifications provided by these cloud companies are often mandated as compulsory training during the onboarding phase for new data scientist and data engineer candidates. As data engineering is focused on building data systems for data scientists, engineers require a better understanding of statistics or machine learning to help communicate and collaborate with the rest of the data team. Data scientists have a more diverse background with undergraduate-level training in computer science, statistics, mathematics, physics, psychology, and life sciences. Data scientists often have more advanced degrees, such as a master’s degree or a PhD, in any of the above disciplines. Though data scientists traditionally had more advanced degrees, particularly the first wave which emerged a decade ago, it is becoming increasingly common for entry-level data science jobs to not have such requirements. Additionally, data scientists work with multiple stakeholders from engineering, analytics, product, and business teams, and it is helpful for them to know a bit about these areas for a smoother and more efficient collaboration. Building a successful, collaborative data product with diverse cross-functional teams requires efficient communication and storytelling skills from data scientists. Specializations With the rising popularity of data science and data engineering jobs, a number of upskilling platforms, courses, and boot camps now offer specialized, practical, hands-on training. These specializations are industry oriented and often developed by leading tech companies such as Google, Microsoft, AWS, IBM, etc. There are also many certification courses that allow candidates to learn specific data skills and signal their motivation and skill set to prospective employers. The following are a selection of specializations or certifications that a successful data engineer may have:
The following are a selection of specializations or certifications that a successful data scientist may have:
However, prospective data engineers or scientists must carefully consider which course is best suited to them given the constraints of finances, time, and interests. It is not feasible nor necessary to undertake as many courses as possible, and it is more important to focus on the courses that can truly improve your understanding and improve your candidature as a data engineer or a data scientist. Career growth differences between data engineers and data scientists Career growth prospects for both data engineers and data scientists are promising. Data engineers can evolve into related roles such as data architect or solutions architect. They can become leaders who envision and lead teams working on data platforms and also transition into more traditional engineering leadership roles. With a better understanding of core data science skills such as statistics and machine learning, data engineers can also switch to data scientist roles. The demand for data scientists has remained consistently strong for over a decade now. There are numerous entry-level positions at companies of all sizes and business domains. Initially restricted to experts with deep domain expertise and doctoral training, data science has now become more democratic with the development of tools and technologies that simplify and automate the various nuts and bolts of the data science lifecycle. Data scientists can progress further to become recognized domain experts as individual contributors or build data science teams and organizations as data science leaders. With a better grasp of software engineering fundamentals such as data structures, algorithms, and optimized coding, data scientists can also switch laterally to become data engineers or machine learning engineers. Final thoughts With rapid advances in data science and the increasing appreciation for its value in business growth, companies are actively building their data science teams and capabilities. The first step involves building the foundational infrastructure for data, a job that is carried out by data engineers. They take care of building data warehouses and pipelines and provide data that is ready to be consumed by data scientists for building various machine learning models and applications. Related Blogs
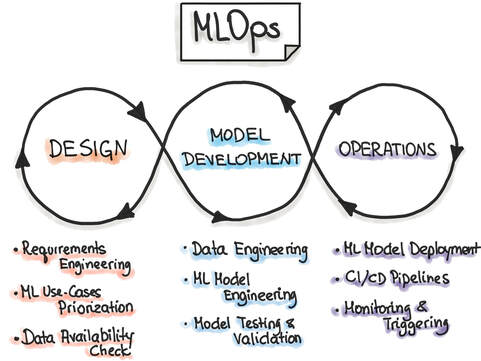 Source: MLOps Org Machine learning operations (MLOps) refer to the emerging field of delivering machine learning models through repeatable and efficient workflows. The machine learning lifecycle is composed of various elements, as shown in the figure below. Similar to the practice of DevOps for managing the software development lifecycle, MLOps enables organizations to smooth the path to successful AI transformation by providing an engineering and technological backbone to underlying machine learning processes.
MLOps is a relatively new field, as the commercial use of AI at scale is itself a fairly new practice. MLOps is modeled on the existing field of DevOps, but in addition to code, it incorporates additional components, such as data, algorithms, and models. It includes various capabilities that allow the modern machine learning team, comprising data scientists, machine learning engineers, and software engineers, to organize the building blocks of machine learning systems and take models to production in an efficient, reliable, and reproducible fashion. MLOps tools MLOps is carried out using a diverse set of tools, each catering to a distinct component of the machine learning pipeline. Each tool under the MLOps umbrella is focused on automation and enabling repeatable workflows at scale. As the field of machine learning has evolved over the last decade, organizations are increasingly looking for tools and technologies that can help extract the maximum return from their investment in AI. In addition to cloud providers, like AWS, Azure, and GCP, there are a plethora of start-ups that focus on accommodating varied MLOps use cases. In this article, I will cover tools for the following MLOps categories:
In the following section, I will list a selection of MLOps tools from the above categories. It is important to note that although a particular tool might be listed under a specific category, the majority of these tools have evolved from their initial use case into a platform for providing multiple MLOps solutions across the entire ML lifecycle. Metadata Management Building machine learning models involves many parameters associated with code, data, metrics, model hyperparameters, A/B testing, and model artifacts, among others. Reproducing the entire ML workflow requires careful storage and management of the above metadata. Featureform Featureform is a virtual feature store. It can integrate with various data platforms, and it enables the management and governance of the data from which features are built. With a unique, feature-first approach, Featureform has built a product called Embeddinghub, which is a vector database for machine learning embeddings. Embeddings are high-dimensional representations of different kinds of data and their interrelationships, such as user or text embeddings, that quantify the semantic similarity between items. MLflow MLflow is an open-source platform for the machine learning lifecycle that covers experimentation and deployment, and it also includes a central model registry. It has four principal components: Tracking, Projects, Models, and Model Registry. In terms of metadata management, the MLflow Tracking API is used for logging parameters, code, metrics, and model artifacts. Versioning For machine learning systems, versioning is a critical feature. As the pipeline consists of various data sets, labels, experiments, models, and hyperparameters, it is necessary to version control each of these parameters for greater accessibility, reproducibility, and collaboration across teams. Pachyderm Pachyderm provides a data layer for the machine learning lifecycle. It offers a suite of services for data versioning that are organized by data repository, commit, branch, file, and provenance. Data provenance captures the unique relationships between the various artifacts, like commits, branches, and repositories. DVC DVC, or Data Version Control, is an open-source version control system for machine learning projects. It includes version control for machine learning data sets, models, and any intermediate files. It also provides code and data provenance to allow for end-to-end tracking of the evolution of each machine learning model, which promotes better reproducibility and usage during the experimentation phase. Experiment Tracking A typical machine learning system may only be deployed after hundreds of experiments. To optimize the model performance, data scientists perform numerous experiments to identify the most appropriate set of data and model parameters for the success criteria. Managing these experiments is paramount for staying on top of the data science modeling efforts of individual practitioners, as well as the entire data science team. Comet Comet is a machine learning platform for managing and optimizing the entire machine learning lifecycle, from experiment tracking to model monitoring. Comet streamlines the experimentation workflow for data scientists and enables clear tracking and visualization of the results of each experiment. It also allows side-by-side comparisons of experiments so users can easily see how model performance is affected. Weights & Biases Weights & Biases is another popular machine learning platform that provides a host of services, including [experiment tracking](https://wandb.ai/site/experiment-tracking). It facilitates tracking and visualization of every experiment, allows rerunning previous model checkpoints, and can monitor CPU and GPU usage in real time. Model Deployment Once a machine learning model is built and tests have found it to be robust and accurate enough to go to production, the model is deployed. This is an extremely important aspect of the machine learning lifecycle, and if not managed well, it can lead to errors and poor performance in production. AI models are increasingly being deployed across a range of platforms, from on-premises servers to the cloud to edge devices. Balancing the trade-offs for each kind of deployment and scaling the service up or down during critical periods are very difficult tasks to achieve manually. A number of platforms provide model deployment capabilities that automate the entire process of taking a model to production. Seldon Seldon is a model deployment software that helps enterprises manage, serve, and scale machine learning models in any language or framework on Kubernetes. It’s focused on expediting the process to take a model from proof of concept to production, and it’s compatible with a variety of cloud providers. Kubeflow Kubeflow is an open-source system for productionizing models on the Kubernetes platform. It simplifies machine learning workflows on Kubernetes and provides greater portability and scalability. It can run on any hardware and infrastructure on which Kubernetes is running, and it is a very popular choice for machine learning engineers when deploying models. Monitoring Once a model is in production, it is essential to monitor its performance and log any errors or issues that may have caused the model to break in production. Monitoring solutions enable setting thresholds as indicators for robust model performance and are critical in solving for known issues, like data drift. These tools can also monitor the model predictions for bias and explainability. Fiddler Fiddler is a machine learning model performance monitoring software. To ensure expected model performance, it monitors data drift, data integrity, and anomalies in the data. Additionally, it provides model explainability solutions that help identify, troubleshoot, and understand underlying problems and causes of poor performance. Evidently Evidently is an open-source machine learning model monitoring solution. It measures model health, data drift, target drift, data integrity, and feature correlations to provide a holistic view of model performance. Conclusion MLOps is a growing field that focuses on organizing and accelerating the entire machine learning lifecycle through best practices, tools, and frameworks borrowed from the DevOps philosophy of software development lifecycle management. With machine learning, the need for tooling is much greater, as machine learning is built on foundational blocks of data and models, as well as code. To bring reliability, maturity, and scale to machine learning processes, a diverse set of MLOps tools are being increasingly used. These tools are developed for optimizing the nuts and bolts of machine learning operations, including metadata management, versioning, model building and experiment tracking, model deployment, and monitoring in production. Over the past decade, the field of AI and machine learning has grown rapidly, with organizations embracing AI and recognizing its critical importance for transforming their business. The field of MLOps is still young, but the creation and adoption of tools will further empower organizations in their journey of AI transformation and value creation. Related Blogs Introduction
Consumer technology companies like Amazon, Yelp, and Airbnb are focused on providing an impeccable customer experience, and reviews are integral to that experience. Reviews from previous customers can signal trust and reliability (e.g., total number of reviews or average star rating), empowering first-time buyers or new customers in their decision-making. Millions of reviews are shared on platforms like Amazon for e-commerce products, on Airbnb for travel and hospitality, on Glassdoor for company and employment experience, and on Google for third-party businesses. However, the internet has become rife with fake reviews. Fake reviews and inflated ratings provide a tainted picture of a product or service and are designed to trick customers away from or toward certain purchases. As these reviews are an important input factor for search and ranking algorithms, they can have a massive influence on product discovery and sales. This provides a strong incentive for bad actors to try to manipulate the system by improving the ratings of their products through fake reviews. There is a booming market for fake reviews, which are purchased via multiple social media and community platforms. The problem is enormous - nearly four percent of all reviews are fake, translating into a global economic impact of USD 152 billion. E-commerce companies like Amazon spend upwards of a billion dollars and employ tens of thousands of workers to combat online fraud and abuse. Some companies use sophisticated technologies including AI to detect and delete fake reviews, but their accuracy is limited (less than forty percent) and it often takes more than one hundred days to remove those reviews. During that time, fraudulent sellers can make strong short-term revenues and profits. Apart from the short-term commercial losses, there is a longer-term problem; fake reviews erode customer trust and safety, causing customers to avoid online purchases. Catching fake reviews is therefore paramount for a majority of online marketplaces and businesses. Characteristics of Fake Reviews Fake reviews have several telltale characteristics. For instance, as they are based on a fraudulent experience with the product or service, fake reviews will often focus on a poor customer experience without specific details about that product or service. Another sign is the repetition of positive or negative keywords and text. As it is difficult to fabricate a review, fake reviewers keep emphasizing certain keywords and details to paint a terrible customer experience. Such reviews accentuate extreme details without providing a balanced perspective. Fake reviewers also excessively use emoticons and exclamation points in an attempt to appeal to the customers’ emotions. Genuine reviewers tend to focus more on information and provide thoughtful, actionable feedback for other customers about the product experience. One clear giveaway is the reviewer’s name and avatar. Fake reviews are usually submitted using an account with a dubious username, avatar, or email address. If a reviewer seems like they could be illegitimate, check whether they have shared any reviews previously, how often, and for which products or businesses. Fake accounts are often created for one-time use, and fake reviewers can submit multiple reviews in a short span of time, sometimes on the same day. Sometimes fake reviewers post a poor rating without any comments to describe their experience. Genuine reviewers take the time and effort to write useful feedback. Spotting these characteristics can help you find many fake reviews, but scamsters are always devising more sophisticated techniques to replace those that have already been detected through algorithms, AI, or human reviewers. One solution to this problem is fingerprinting technology, that can identify unique users of your website regardless of VPNs, cookie blockers, private browsing, or other tools. They use data including the browser and device used, usage patterns, IP addresses, and geolocation to create a unique identifier for site visitors, making it easier to spot users trying to hide their identity or committing fraudulent activity. Conclusion Fake reviews have undermined the revenue and growth of online sellers and small businesses. These reviews can boost the sales of a poor product by exaggerating its positive rating, or damage the sales of competitor products via negative reviews. While there are ways to catch these fake reviewers in the act, it’s an increasingly sophisticated scam and a headache for businesses. Fingerprinting technology can help you find and remove fake reviews as well as protect your business from all types of online fraud. This helps ensure that your customers will have a safe and reliable online shopping experience. Recently, the Government of India issued a draft framework of standards to counter fake reviews in order to reduce their prevalence on e-commerce platforms. Related Blog If you have worked on a large engineering product, the odds are that you did not build it in isolation but in collaboration with colleagues from diverse domains. It’s common for software projects to involve product, business, marketing, design, analytics, customer support, end-users, and C-suite leaders. All of these people with a vested interest in the success of your product represent your stakeholders.
The tech industry is littered with numerous failed products from Amazon’s Fire phone to Google+. One of the common recurring reasons is poor stakeholder management and coordination. Knowing who your stakeholders are, understanding their incentives and priorities, aligning their interests, getting buy-in, and leveraging their expertise is critical for the success of your product. Just one of the stakeholders being misaligned makes developing your product much harder, so it is imperative that you manage stakeholders from the conception to the launch of your product. I have seen several products fail due to poor planning and management of stakeholders. In this article, I will provide some insights on effectively managing your stakeholders as an engineering leader. Identifying Your Stakeholders The first step is to identify the stakeholders that are critical to the success of your product, understand their motivation and priorities, and their relative importance and influence. Successful stakeholder management starts by mapping your stakeholders across several dimensions, including:
A stakeholder mapping exercise will help you identify the most important stakeholders during each phase of the product development lifecycle. This helps you later as you develop optimal strategies to balance the diverse perspectives of each stakeholder, manage any inevitable conflicts, and build unique communication methods for each one. An important point that many articles on this topic omit is that stakeholder mapping is not static. It must be modified as individual stakeholders are replaced or reallocated to the project. For instance, if your VP of Product is replaced by a new one, the mapping has to be redrawn based on your new VP’s motivations and priorities. These will almost certainly affect your roadmap for any products under development. Prioritizing Your Stakeholders Every stakeholder contributes unique expertise that is pivotal for your product’s success, but their relative interest, importance, influence, and level of contribution varies across the product lifecycle. Using your stakeholder map, identify the most important stakeholders and engage them accordingly. Remember that CXOs aren’t necessarily the most important stakeholders at every stage of a product’s development. For instance, while C-level business leaders are crucial for providing initial budget and sign-off, during the development phase, your product and design stakeholders are often more relevant. Furthermore, if you lose touch with the end-users during the development phase, you might end up building a product missing features that customers want. I saw this recently when another engineering team started a new project. After getting initial buy-in from leadership and validating the customers’ needs, the manager was replaced. Instead of re-assessing the team’s priorities and confirming stakeholder alignment, the team got out of sync with the deliverables that customers needed. At the end of a year-long development cycle, they launched the product, but customers were no longer bought in. The team essentially lost a year’s worth of effort because they didn’t keep all the relevant stakeholders in mind throughout the development process. Aligning Stakeholders While stakeholder mapping is a necessary first step, conflicting priorities amongst stakeholders are common and need to be resolved delicately. You can preempt certain stakeholder conflicts by keeping conflicting interests in mind. Achieving multi-stakeholder alignment requires carefully planned discussions and negotiations to assess the lay of the land with each stakeholder. Focused group meetings prioritizing key points of disagreement or conflicting priorities can help you achieve alignment and avoid conflicts down the line. Additionally, knowing which stakeholders are most likely to back your project through challenging times and which are likely to abandon you is important. Learn when to fight fires on your own and when to seek out more experienced mentors in your company to provide a different perspective. The strategy for stakeholder alignment works differently in small startups than it does in large, multi-layered organizations. In a startup, speed of execution is critical while enterprise teams may have many layers of bureaucracy impeding velocity. Both have their challenges, but it’s important not to treat them the same. Keeping Stakeholders Up to Date After getting all the stakeholders aligned, you need a communication strategy to share updates on the project at set intervals. Tailor your communication plan according to the importance, expertise, and priorities of each stakeholder. For example, the project’s contributors might need a high-touch approach, while executives might just want periodic updates and high-level presentations. There are several appropriate modes of communication apart from 1:1 meetings, especially now that so many teams are remote. At a minimum, you should maintain a project status board detailing the progress of each milestone, KPI, team member, and estimated timeline. Popular software and tools that facilitate structured project management include: While a project board might be enough for some stakeholders, others may want more explicit communication. As an engineering leader, be proactive about this communication, leveraging video conferencing and messaging tools to help keep stakeholders in the loop. Finally, group status updates can be productive when addressing stakeholders who are too busy to read or watch pre-recorded videos. These meetings are especially helpful if you need signoff from several parties to proceed. Engaging Stakeholders and Taking Feedback During the execution phase of the project, continuous engagement and clear communication with your stakeholders is essential to maintain their interest and trust. Stakeholders are often involved in a multitude of projects, and your project may not be their top priority. While giving stakeholders regular updates can help, it’s also helpful to get their buy-in or actively involve them in some parts of the project. As long as the key stakeholders are satisfied, there is less likelihood of difficult surprises down the road. Often, stakeholders will express disappointment or frustration with your team’s work, rate of progress, or specific decisions related to product development. Feedback - both positive and negative - helps your team apprise their project status and course-correct accordingly, so first, evaluate the feedback to understand whether it’s valid or a simple miscommunication. Leveraging your objective analysis will enable you to respond to the stakeholders’ concerns accordingly and manage their expectations better in the future. Whenever situations like this arise, follow up by bringing these stakeholders into decisions earlier and ensuring they have the information they need to suggest changes earlier. Finally, use feedback as an opportunity to understand what contributes to stakeholder satisfaction with the project. There might be a new process you can implement to avoid similar misunderstandings on future projects. Developing Your Stakeholder Management Skills For new engineering leaders, the art of stakeholder management might take some time to master. If you feel like you’re struggling with it, find mentors (typically senior engineering leaders in your organization) and look into external professional training. Successful stakeholder management requires a host of soft skills, including communication, empathy, and persuasiveness. “You need to be able to communicate and collaborate with other engineers who are working on different pieces of that system, as well as cross-functionally with product managers, designers, and others who are contributing to the design of the system that you’ll help implement.” - David Kaminsky, Senior Engineering Manager at StubHub While some technical experts might dismiss the relevance of these skills when they’re in individual contributor roles, in my experience, the most successful engineering leaders combine strong technical acumen with excellent interpersonal skills. Conclusion The success of your software or engineering product depends on your ability to successfully collaborate with and manage cross-functional stakeholders across the entire product development lifecycle. Identifying your key stakeholders and understanding their priorities lays the foundation for achieving strong cross-functional stakeholder alignment. This foundation can be further cemented with smart communication strategies and tools to keep your stakeholders abreast of the progress and vested in the success of your product. Stakeholder management is not a new topic, but no two managers do it the same way. You have to incorporate your context, industry, and strengths to find a set of practices that work for you. Related Blogs Published by CloudForecast Introduction
Amazon Redshift is a widely used cloud data warehouse that is used by many businesses, like Nasdaq, GE, and Zynga, to process analytical queries and analyze exabytes of data across databases, data lakes, data warehouses, and third-party data sets. There are multiple use cases for Redshift, including enhancing business intelligence capabilities, increasing developer and analyst productivity, and building machine learning models for predictive insights, like demand forecasting. Amazon Redshift can be leveraged by modern data-driven organizations to vastly improve their data warehousing and analytics capabilities. However, the pricing for Redshift services can be challenging to understand, with multiple criteria that define the total cost. In this article, you’ll learn about Amazon Redshift and its pricing structure, with suggestions for how to optimize costs. What Is Amazon Redshift? Essentially, Amazon Redshift provides analytics over multiple databases and offers high scalability in a secure and compliant fashion. Additionally, there is a serverless option called Amazon Redshift Serverless that makes it even easier to rapidly scale analytics setup without requiring a managed data warehouse infrastructure. It helps with data democratization and assists various data stakeholders to extract data insights by simply loading and querying data in the warehouse. Amazon Redshift Pricing In this section, you’ll learn about Amazon Redshift’s capabilities as it pertains to usage and pricing. Free Tier For new enterprise users, the AWS Free Tier provides a free two-month trial of the DC2.Large node. This free service includes 750 hours per month, which is sufficient to run a single DC2.Large node with 160GB of compressed solid-state drives (SSD). On-Demand Pricing When you launch an Amazon Redshift cluster, you select a number of nodes in a specific region as well as their instance type to run your data warehouse. In on-demand pricing, a simple hourly rate applies based on the previous configuration and is billed as long as the cluster is live. The typical hourly rate for a DC2.Large node is $0.25 USD per hour. Redshift Serverless Pricing With Amazon Redshift Serverless, costs accrue only when the data warehouse is active and is measured in units of Redshift Processing Units (RPUs). You’re charged in terms of RPU-hours on a per-second basis. The serverless configuration also includes concurrency scaling and Amazon Redshift Spectrum, and the cost for these services is already included. Managed Storage Pricing Amazon Redshift charges for the data stored in a managed storage at a specific rate per GB-month. Its usage is calculated on an hourly basis as a function of the total amount of data and starts as low as $0.024 USD per GB with the RA3 node. The cost of a managed storage also varies according to the particular AWS region in which the data is stored. For example, consider the cost of a managed storage pricing where 100TB of data is stored with an RA3 node type for thirty days in the US East region, where the cost is $0.024 USD per GB-month. The total usage for thirty days in GB-hours is as follows: 100TB × 1024GB/TB (converting TB to GB) × 30 days × 24 hours/day = 73,728,000 GB-hours Then you can convert GB-hours to GB-months: 73,728,000 GB-hours / (24 × 30) hours per month = 102,400 GB-months Finally, you can calculate the total cost of 102,400 GB-months at $0.024 USD/GB-month in the US East region: 102,400 GB-months × $0.024 USD = $2,457.60 USD Spectrum Pricing With Amazon Redshift Spectrum, users can run SQL queries directly on the data in the S3 buckets. Here, the cost is based on the number of bytes scanned by the Spectrum utility. The pricing of Redshift Spectrum is $5 USD per terabyte of data scanned. Concurrency Scaling Pricing With Concurrency Scaling, Amazon Redshift can be scaled to multiple concurrent users and queries. For every twenty-four hours that your main cluster is live, you accrue a one-hour credit. Any additional usage is charged on a per-second, on-demand rate that depends on the number of types of nodes in the main cluster. Reserved Instance Pricing Reserved instances are designated for stable production workloads and are less expensive than clusters run on an on-demand basis. Significant cost savings can be achieved through long-term usage and commitment to Amazon Redshift in the span of a few years. Pricing for reserved instances can either be paid all up front, partially up front, or monthly over the course of a year with no up-front charges. Amazon Redshift Cost Optimization Considerations Before you begin using Amazon Redshift, you need to be aware of your current costs. AWS Cost ExplorerThe AWS Pricing Calculator provides a configurable tool to estimate the cost of using Amazon Redshift. For instance, the annual cost of one node of the DC2.8xlarge instance in the US East (Ohio) region on an on-demand basis is as follows: 1 instance × $4.80 USD hourly × 730 hours in a month × 12 months = $42,048 USD The cost for the same Amazon Redshift configuration for a reserved instance for a one-year term paid up front is $27,640 USD. AWS Tags Using AWS cost allocation tags can help you decode and manage your AWS costs. Tagsenable AWS resources to be labeled in the form of key-value pairs and can include various types, like technical, business, security, and automation. Once the tags are activated in the Billing and Cost Management console, a cost allocation report can be generated based on the specific resources tagged. Tags can be user-defined or AWS-generated. Amazon Redshift Cost Optimization Optimizing Amazon Redshift costs comes down to effective planning, prudent usage and allocation of resources, and regular monitoring of the usage and associated costs. Optimizing Queries The analytical queries made on the data stored in Amazon Redshift can be optimized to run more efficiently. Queries can be compute-intensive, can be storage-intensive, or can take a long time to execute. There are a number of query tuning techniques that can be used to optimize your queries. Tables with skewed data or missing statistics, and queries with nested loops and long wait times, typically affect query performance and can be improved as illustrated in this AWS developer guide. Here is a commonly used weak query that selects all the columns in a table: SELECT * FROM USERS The previous query can be very inefficient and slow if the table consists of thousands of columns, especially if only a few columns are relevant for the necessary analysis. This query can be optimized by specifying and retrieving the exact column names like the following: SELECT Firstname, Lastname, DOB FROM USERS Cluster Limits and Quotas Usage limits on Amazon Redshift clusters can be programmed using the AWS Command Line Interface (CLI) tool. Limits can be imposed on concurrency scaling in terms of time and spectrum in terms of data scanned. Daily, weekly, or monthly periods can be used. A number of limits and quotas are defined for Redshift resources that can also be applied to constrain the overall costs associated with Redshift. Data Type Amazon Redshift costs can also be managed by storing data in a compressed, partitioned, and columnar data format, like Apache Parquet, since fewer data is scanned. Conclusion Amazon Redshift is a powerful and cost-effective cloud-native data warehouse that provides scalable and performant data analytics and processing capabilities. It also comes with a serverless configuration that allows any data stakeholder to run data queries without the need to provision and manage the data warehouse infrastructure. Amazon Redshift has multiple aspects affecting its pricing, including on-demand or reserved capabilities, serverless, managed storage pricing, Redshift Spectrum pricing, concurrency scaling pricing, and reserved instance pricing. Keeping on top of the various Amazon Redshift costs is not straightforward but can be made easier by AWS cost monitoring tools, like CloudForecast. CloudForecast helps manage AWS costs through daily cost management reports, monthly financial reports, untagged AWS resources discovery, and idle and underutilized resources visibility for cost-saving opportunities. Related blog Published by CloudForecast Introduction
Companies are increasingly moving their production code to serverless functions using AWS Lambda, which has gained popularity for its better code maintenance, low-cost hosting charges, and automatically scaled and optimized performance. But without careful oversight, Lambda can become an expensive choice for your project. Lambda, offered by market-leading AWS, offers many benefits. Lambda is one example of serverless functions, or single-purpose, programmatic functions hosted and maintained by cloud providers like AWS, Azure, or GCP to ensure near-perfect runtime and scaling to any incoming network request volume. Companies can use Lambda, an event-driven compute service, to run any type of application or backend service without worrying about provisioning or managing servers. Lambda adapts to a variety of use cases across startups and enterprises alike. It can process data at scale, run interactive web and mobile backend services, enable powerful machine learning models, and build in-house event-driven applications. It also specifies limits for the amount of compute and storage resources used to run and store serverless functions. These limits apply to a number of resources, such as the number of concurrent executions; storage for uploaded functions as well as quotas for function configuration; deployment and execution parameters like memory allocation; timeout; environment variables; layers; and burst concurrency. The key to using Lambda is keeping your costs in check. This article will review Lambda’s pricing structure to show how costs can be efficiently managed without compromising on operational excellence and execution of Lambda functions. It will also discuss tools like CloudForecast that can help engineering teams monitor and reduce their serverless computing costs on AWS. Understanding AWS Lambda Pricing AWS Lambda pricing is based on the amount of memory allocated to the serverless function and the amount of time the code runs, rounded to the nearest millisecond. The key variables that determine Lambda costs are the type of architecture, the number of requests, the time frame for which the requests apply, the duration of each request (in milliseconds), and the amount of memory allocated to the Lambda function. Each Lambda request starts when code executes in response to an event trigger from services like Amazon’s Simple Notification Service or calls from Amazon API Gateway or via the AWS SDK. The cost for each compute and storage resource is calculated depending on the function configuration. AWS offers a free tier that allows one million free requests per month and 400,000 GB-seconds of compute time per month powered by x86 and Graviton2 processors. It also offers a flexible pricing model called the Compute Savings Plan, based on guaranteed usage (measured in dollars per hour) for a one- or three-year term. AWS Lambda does offer an attractive feature called Provisioned Concurrency that enables greater control over start-up latency when Lambda functions are triggered. Provisioned concurrency solves the problem of variable start-up latency when a Lambda service is triggered on demand and scales up to meet the needs of the application workloads. This overhead in starting a Lambda function is referred to as cold start, and the magnitude of this problem is a function of the time taken to set up the execution environment and the duration for the code to be initialized. As illustrated in this official AWS example, with provisioned concurrency enabled, the percentage of requests served within a given time remains fairly constant—especially for the slowest five percent of the requests—in comparison to a scenario with provisioned concurrency disabled. At scale, this can have a massive impact not only on the costs but also on the user experience. While the first factor is controlled by AWS, the second factor falls to the developer. The code initialization duration is predominantly responsible for cold start latency. Provisioned concurrency solves for cold start by enabling Lambda functions to be initialized for high workloads in milliseconds. AWS provides a pricing calculator to estimate the cost of using Lambda for your applications. The below estimate provides pricing calculations for a sample application with the following settings:
The same pricing calculator can also provide an estimate for provisioned concurrency. In this case, in addition to the above parameters, the cost is a function of the amount of concurrency specified and the period of time the configuration is active. Controlling AWS Lambda Costs AWS Lambda does offer options for controlling costs, but as the above example showed, the cost of function calls can quickly scale up as part of the organizational application workload. If the configuration is not carefully monitored and fine-tuned for current applications, Lambda can become prohibitively expensive. You can keep AWS Lambda costs down by focusing on three important factors:
The cost of a Lambda function invocation is multiplied by its execution time and memory size, so reducing either factor by even a small amount can have a significant impact on billable costs. It’s important to ensure you have the correct configuration. Periodic monitoring of the actual values of the memory size and the number and duration of function calls can help confirm whether the current configuration is fine-tuned for the current workload. AWS Lambda logs are ingested into Amazon CloudWatch, so mining these logs can help optimize the configuration and the costs. External tools like CloudForecast can also monitor usage and costs. Avoiding high maximum execution time also helps save costs. It’s common to have a buffer of execution time beyond what’s specified, but the additional costs incurred by Lambda functions add up, making it prudent to change the value of the “duration of each request” parameter as needed. Lambda Step Functions can also help manage costs. Step functions are state machines with a visual workflow that allow developers to coordinate different tasks like calling various Lambda functions. Using step functions is a more efficient way to poll for the status of tasks. Typically, long polling increases the costs of Lambda functions as they are waiting idle, and step functions help alleviate the total costs based on the number of state transitions to execute the application, instead of the execution time of a workflow. Another tactical method to control Lambda costs is to evaluate whether your application can be run asynchronously. Running async workloads prevents idle downtime in which the AWS Lambda functions wait for external applications to complete. If the overall architecture can be analyzed for idle instances and reconfigured for asynchronous execution, the costs of Lambda functions can be drastically reduced. The frequency at which Lambda functions are invoked can also impact the usage and costs. Where applications like Kinesis are used as a Lambda function trigger, increasing the batch size can reduce the frequency at which the Lambda function needs to be invoked, thus reducing the total number of executions. Writing optimized production code always helps, and its lower execution time can reduce Lambda costs. You can, for instance, record and analyze the Duration metric in CloudWatch for slow execution times. For some applications, EC2 spot instances may be cheaper and more effective than Lambda functions. This is especially true for an application architecture in which the traffic is predictable and sustained, making a reliable EC2 spot instance a more suitable alternative. Conclusion AWS Lambda and serverless functions have had a tremendous impact on the efficient execution of software, data, and machine learning applications in the cloud. Lambda can help you achieve savings on your engineering costs, but it’s possible to reduce your costs even more by optimizing the configuration of your applications and fine-tuning your resources. Doing this work manually can require careful logging and monitoring of your application in production settings. Instead, you can use tools to automate and dynamically adjust Lambda function settings to reduce costs in a more cost- and time-efficient manner. One of those tools is CloudForecast, which can manage and optimize the cost of using AWS services like Lambda. CloudForecast provides an out-of-the-box solution for engineering teams to monitor their monthly budget and move toward a more responsible use of Lambda functions. Its detailed reports suggest ways to reduce AWS costs, and it can also provide reports for your finance and accounting teams. To learn more about how CloudForecast can help with your AWS Lambda costs, check its official blog. Related blog Strong engineering talent is the bedrock of modern technology companies. Software engineers, in particular, are in high demand given their expertise and skills. At the same time, there is a much greater supply of software companies and startups, all of which are jostling to hire top engineers. Given this market reality, retention of top engineering talent is imperative for a company to grow and innovate in the short as well as the long term.
Retaining employees is critical for numerous reasons. It helps a company retain experience not only in terms of employees’ domain expertise and skills, but also organizational knowledge of products, processes, people, and culture. Strong employee retention rates (>90%) ensure a long-term foundation for success and enhances team morale as well as trust in the company. A stable engineering team is in a better position to both build and ship innovative products and establish a reputation in the market that helps attract top-quality talent. The corporate incentive of maintaining high standards of employee hiring and retention is also related to the costs of employee churn. Turnover costs companies in the US $1 trillion USD a year with an annual turnover rate of more than twenty-six percent. The cost of replacing talent is often as high as two times their annual salary. This is a tremendous expense that can be averted through better company policies and culture. The onus is typically on the human resources (HR) team to develop more employee-friendly practices and promote higher engagement and work–life balance. However, in practice, most HR teams are deferential to the company leadership and that is where the buck stops. Leaders and managers have a fundamental responsibility to retain the employees on their team, as more often than not, employees do not leave the company per se, but the line manager. I will discuss best practices and strategies to improve retention, which ought to be a consistent effort across the entire employee lifecycle--from recruiting to onboarding through regular milestones during an employee’s tenure. Start at the Start More often than not, managers do not invest in onboarding preparation and processes out of laziness and indifference. Good employee retention practice starts at the very beginning, i.e., at the time of hiring. Hiring talent through a structured, transparent, fair, and meritocratic interviewing process that allows the candidate to understand their particular role and responsibilities, the company’s diversity and inclusion practices, and the larger mission of the company sets an important tone for future employees. Hiring the right people who are a good culture fit increases the likelihood of greater engagement and longer tenure at the company. Hiring managers should not hire for the sake of hiring. They should put considerable thought into each new hire and how that hire might fit in on their team. Apart from hiring, managers have other important considerations, including:
In the first few months, the new hires, the hiring team, and company are in a “dating” phase, evaluating each other and gathering evidence on whether to commit to a longer-term relationship. Most new employees make up their mind to stay or leave within the first six months. A third of new hires who quit said they had barely any onboarding or none at all. The importance of a new employee’s first impressions on the joining date, the first week, the first month, and the first quarter cannot be overemphasized. Great onboarding starts before the new hire’s join date, ensuring all necessary preparation is handled, like paperwork. Orientation programs on the join day are essential to introduce the company and expand on its mission, values, and culture beyond what the employee might have learned during the interviews. Minor things like having the team know in advance about a new team member’s join date, and readying the desk, equipment, access, and logins are tell-tale signs of how much thought and effort the hiring team has invested in onboarding. Fellow teammates also make a significant impact, whether they are welcoming and drop in to say “hi” or stop by for a quick chat to get to know the hire better, or take the new employee out for lunch with the whole team. Onboarding should not end on day one but continue in various forms. Some examples include:
A successful onboarding strategy should enable the employee to know their first project, the expectations, associated milestones, and how performance evaluation works. Keep It Up! Onboarding should be followed up with regular check-ins by the manager and HR at the one-month, three-month, and six-month mark. These meetings should be treated as an opportunity for the company to assess the new employee’s comfort level on the team and provide feedback as needed. An onboarding mentor or buddy, if not assigned already, should be provided to help the employee find their feet and learn the informal culture and practices. The manager should set up the employee for success by providing low-hanging projects that are quick to deliver and help the new hire understand the process of building and deploying a new feature using the company’s internal engineering tools and systems. With quick wins, new hires are able to build trust within the organization and gain more confidence to do excellent work. As time goes on, the role of the hiring manager becomes more prominent in coordinating regular 1-on-1 meetings, providing the new hire clear work guidelines, as well as challenging and stimulating projects. Apart from work, an introduction to the organizational setup and culture, as well as social interaction within and beyond the team is also crucial. As the new employee ramps up, it is important to give constructive feedback so that the employee can improve. Where a new employee delivers positive impact in the early days itself, the manager should highlight their work within the team and organization, and motivate the employee to continue to perform well. In addition to core engineering work, employees feel more connected when a company actively invests in their learning and development. Cross-functional training programs that involve employees across different teams foster deeper collaboration and a stronger sense of connection within the various parts of the company. Investment in employees’ upskilling and education via partnership with external learning platforms or vendors also generates a positive culture of instilling curiosity and learning. Learning new skills energizes the employees and provides them opportunities to grow and develop. They can then apply the newly learned knowledge and skills to pertinent business problems. It creates a virtuous culture that yields overall positive outcomes for the employee and employer alike, and positively influences the long-term retention rates. New employees generally feel the need to be positively engaged. A powerful mission statement can sometimes convert naysayers faster and generate a company-wide sense of being part of something impactful. This fosters deeper engagement, loyalty, and trust in the company and helps employees embrace company values, resulting in better employee retention rates. Frequent town hall meetings from the leadership enable a new hire to understand the organization as a coherent whole and their particular role in furthering the company’s mission. Listen to Feedback The diverse organizational efforts to onboard, engage, and enhance new employees’ perception of the company are bound to fail if the organization does not seek and act on any feedback shared by the new hires. Companies ought to create an internal culture of open communication whereby they seek feedback from employees via surveys, meetings, and town halls, and showcase transparent efforts in implementing employees’ suggestions and feedback. Regular 1-on-1 meetings with managers should be treated as an opportunity to gather feedback and offer the employee insights into whether and how the company is taking action on that feedback. However, in spite of organizational efforts to improve employee satisfaction and wellbeing, some attrition is inevitable. Attrition rates of more than ten percent is a cause for concern, however, especially when top-performing employees leave the company. Exit interviews are typically conducted by HR and hiring managers, but in practice these are largely farcical as the employees hardly share their honest opinions and have lost trust that the company can take care of their career interests and development. Companies can implement processes that bring greater transparency around employee decisions related to hiring, promotion, and exit. These processes will also hold HR and managers to greater accountability with respect to employee churn, and incentivize them to increase the retention rates in their teams. In past generations, job stability was a paramount aspiration for employees which meant they typically spent all their working lives at the same company. In today’s world, with a plethora of enterprises and new startups, high-performing talent is in greater demand and it is possible to accelerate one’s career growth by frequently job hopping and switching companies. Nowadays, feedback about company processes, culture, compensation, interviews, and so on, is available on a plethora of public platforms including Glassdoor and LinkedIn. Companies are now more proactive in managing their online reputation and act on feedback from the anonymous reviews on such platforms. Conclusion Employees in the post-Covid remote-working world are prone to greater degrees of stress, mental health issues, and burnout, all of which have adverse impacts on their work–life balance. In such extraordinary times, companies face the unique challenge—and opportunity—to develop and promote better employee welfare practices. At one end of the spectrum, there are companies like Amazon. In 2015, The New York Times famously portrayed the company as a “bruising workplace.” Then, in 2021, The New York Times again reported on Amazon for poor workplace practices and systems, prompting a public acknowledgment from the CEO that Amazon needs to do a better job. On the other end of the spectrum, there are companies like Atlassian or Spotify that have made proactive changes in their organizational culture and are being lauded for new practices to promote employee welfare during the pandemic. Companies that adapt to the changing times and demonstrate that they genuinely care for their employees will enjoy better retention rates, lower costs due to frequent rehiring, and long-term employee trust that conveys the company as a beacon of progressive workplace culture and employment practices. Related Blogs
Data science teams are an integral part of early-stage or growth-stage start-ups as midlevel and enterprise companies. A data science team can include a wide range of roles that take care of the end-to-end machine learning lifecycle from project conceptualization to execution, delivery, and monitoring:
The manager of a data science team in an enterprise organization has multiple responsibilities, including the following:
As the data science manager, it’s critical to have a structured, efficient hiring process, especially in a highly competitive job market where the demand outstrips the supply of data science and machine learning talent. A transparent, thoughtful, and open hiring process sends a strong signal to prospective candidates about the intent and culture of both the data science team and the company, and can make your company a stronger choice when the candidates are selecting an offer. In this blog, you’ll learn about key aspects of the process of hiring a top-class data science team. You’ll dive into the process of recruitment, interviewing, and evaluating candidates to learn how to find the ones who can help your business improve its data science capabilities. Benefits of an Efficient Hiring Process Recent events have accelerated organizations’ focus on digital and AI transformation, resulting in a very tight labor market when you’re looking for data sciencedigital skills, like machinelike data science and machine learning, statistics, and programming. A structured, efficient hiring process enables teams to move faster, make better decisions, and ensure a good experience for the candidates. Even if candidates don’t get an offer, a positive experience interacting with the data science and the recruitment teams makes them more likely to share good feedback on platforms like Glassdoor, which might encourage others to interview at the company. Hiring Data Science Teams A good hiring process is a multistep process, and in this section, you’ll look at every step of the process in detail. Building a Funnel for Talent Depending on the size of the data science team, the hiring manager may have to assume the responsibility of reaching out to candidates and building a pipeline of talent. In larger organizations, managers can work with in-house recruiters or even third-party recruitment agencies to source talent. It’s important for the data science managers to clearly convey the requirements for the recruited candidates, such as the number of candidates desired and the profiles of those candidates. Candidate profiles might include things like previous experience, education or certifications, skill set or tech stack, and experience with specific use cases. Using these details, recruiters can then start their marketing, advertising, and outreach campaigns on platforms, like LinkedIn, Glassdoor, Twitter, HackerRank, and LeetCode. In several cases, recruiters may identify candidates who are a strong fit but who may not be on the job market or are not actively looking for new roles. A database of all such candidates ought to be maintained so that recruiters can proactively reach out to them at a more suitable time and reengage the candidates. Another trusted source of identifying good candidates is through employee referrals. An in-house employee referral program that incentivizes current employees to refer candidates from their network is often an effective way to attract the specific types of talent you’re looking for. The data science leader should also publicize their team’s work through channels, like conferences or workshops, company blogs, podcasts, media, and social media. By investing dedicated time and energy in building up the profile of the data science team, it’s more likely that candidates will reach out to your company seeking data science opportunities. When looking for a diverse set of talent, the search an be difficult as data science is a male dominated field. As a result, traditional recruiting paths will continue to reflect this bias. Reaching out and building relationships with groups such as Women in Data Science, can help broad the pipeline of talent you attract. Defining Roles and Responsibilities Good candidates are more likely to apply for roles that have a clear job description, including a list of potential data science use cases, a list of required skills and tech stack, and a summary of the day-to-day work, as well as insights into the interviewing process and time lines. Crafting specific, accurate job descriptions is a critical—if often overlooked—aspect of attracting candidates. The more information and clarity you provide up front, the more likely it is that candidates have sufficient information to decide if it’s a suitable role for them and if they should go ahead with the application or not. If you’re struggling with creating this, you can start with an existing job description template and then customize it in accordance with the needs of the team and company. It's also critical to not over populate a job description with every possible skill or experience you hope a candidate brings. That will narrow your potential applicant pool. Instead focus on those skills and experiences that are absolutely critical. The right candidate will be able to pick up other skills on the job. It can be useful for the job description to include links to any recent publications, blogs, or interviews by members of the data science team. These links provide additional details about the type of work your team does and also offer candidates a glimpse of other team members. Here are some job description templates for the different roles in a data science team: Interviewing process When compared to software engineering interviews, the interview process for data science roles is still very unstructured, and data science candidates are often uncertain about what the interview process involves. The professional position of data scientist has only existed for a little over a decade, and in that time, the role has evolved and transformed, resulting in even newer, more specialized roles, such as data engineer, machine learning engineer, applied scientist, research scientist, and product data scientist. Because of the diversity of roles that could be considered data science, it’s important for a data science manager to customize the interviewing process depending on the specific profile they’re seeking. Data scientists need to have expertise in multiple domains, and one or more second-round interviews can be tailored around these core skills:
Given how tight the job market is for data science talent, it’s important to not over complicate the process. The more steps in the process, the longer it will take and the higher the likelihood you will lose viable candidates to other offers. So be thoughtful in your approach and evaluate it periodically to align with the market. Types of Data Science Interviews Interviews are often a multistep process and can involve multiple steps of assessments. Screening Interviews To save time, one or more screening rounds can be conducted before inviting candidates for second-round interviews. These screening interviews can take place virtually and involve an assessment of essential skills, like programming and machine learning, along with a deep dive into the candidate’s experience, projects, career trajectory, and motivation to join the company. These screening rounds can be conducted by the data science team itself or outsourced to other companies, like HackerRank, HackerEarth, Triplebyte, or Karat. Onsite Interviews Once candidates have passed the screening interviews, the top candidates will be invited to a second interview, either virtually or in person. The data science manager has to take the lead in terms of coordinating with internal interviewers to confirm the schedule for the series of interviews that will assess the candidate’s skills, as described earlier. On the day of the second-round interviews, the hiring manager needs to help the candidate feel welcome and explain how the day will proceed. Some companies like to invite candidates to lunch with other team members, which breaks the ice by allowing the candidate to interact with potential team members in a social setting. Each interview in the series should start by having the interviewer introduce themself and provide a brief summary of the kind of work they do. Depending on the types of interviews and assessments the candidate has already been through, the rest of the interview could focus on the core skill set to be evaluated or other critical considerations. Wherever possible, interviewers should offer the candidate hints if they get stuck and otherwise try to make them feel comfortable with the process. The last five to ten minutes of each interview should be reserved for the candidate to ask questions to the interviewer. This is a critical component of second-round interviews, as the types of questions a candidate asks offer a great deal of information about how carefully they’ve considered the role. Before the candidate leaves, it’s important for the recruiter and hiring manager to touch base with the candidate again, inquire about their interview experience, and share time lines for the final decision. Technical Assessment It is common for there to be some sort of case study or technical assessment to get a better understanding of a candidate’s approach to problem solving, dealing with ambiguity and practical skills. This provides the company with good information about how the candidate may perform in the role It also is an opportunity to show the candidate what type of data and problems they may work on when working for you. Evaluating candidates After the second-round interviews and technical assessment, the hiring manager needs to coordinate a debrief session. In this meeting, every interviewer shares their views based on their experience with the candidate and offers a recommendation if the candidate should be hired or not. After obtaining the feedback from each member of the interview panel, the hiring manager also shares their opinion. If the candidate unanimously receives a strong hire or a strong no-hire signal, then the hiring manager’s decision is simple. However, there may be candidates who perform well in some interviews but not so well in others, and who elicit mixed feedback from the interview panel. In cases like this, the hiring manager has to make a judgment call on whether that particular candidate should be hired or not. In some cases, an offer may be extended if a candidate didn’t do well in one or more interviews but the panel is confident that the candidate can learn and upskill on the job, and is a good fit for the team and the company. If multiple candidates have interviewed for the same role, then a relative assessment of the different candidates should be considered, and the strongest candidate or candidates, depending on the number of roles to be filled, should be considered. While most of the interviews focus on technical data science skills, it’s also important for interviewers to use their time with the candidate to assess soft skills, like communication, clarity of thought, problem-solving ability, business sense, and leadership values. Many large companies place a very strong emphasis on behavioral interviews, and poor performance in this interview can lead to a rejection, even if the candidate did well on the technical assessments. Job Offer After the debrief session, the data science manager needs to make their final decision and share the outcome, along with a compensation budget, with the recruiter. If there’s no recruiter involved, the manager can move directly to making the candidate an offer. It’s important to move quickly when it comes to making and conveying the decision, especially if candidates are interviewing at multiple companies. Being fast and flexible in the hiring process gives companies an edge that candidates appreciate and take into consideration in their decision-making process. Once the offer and details of compensation have been sent to the candidate, it’s essential to close the offer quickly to prevent candidates from using your offer as leverage at other companies. Including a deadline for the offer can sometimes work to the company’s advantage by incentivizing candidates to make their decision faster. If negotiations stretch and the candidate seems to lose interest in the process, the hiring manager should assess whether the candidate is really motivated to be part of the team. Sometimes, it may move things along if the hiring manager steps in and has another brief call with the candidate to help remove any doubts about the type of work and projects. However, additional pressure on the candidates can often work to your disadvantage and may put off a skilled and motivated candidate in whom the company has already invested a lot of time and money. Conclusion In this article, you’ve looked at an overview of the process of hiring a data science team, including the roles and skills you might be hiring for, the interview process, and how to evaluate and make decisions about candidates. In a highly competitive data science job market, having a robust pipeline of talent, and a fast, fair, and structured hiring process can give companies a competitive edge. Related Blogs Published by Domino Data Lab Reproducibility is a cornerstone of the scientific method and ensures that tests and experiments can be reproduced by different teams using the same method. In the context of data science, reproducibility means that everything needed to recreate the model and its results such as data, tools, libraries, frameworks, programming languages and operating systems, have been captured, so with little effort the identical results are produced regardless of how much time has passed since the original project.
Reproducibility is critical for many aspects of data science including regulatory compliance, auditing, and validation. It also helps data science teams be more productive, collaborate better with nontechnical stakeholders, and promote transparency and trust in machine learning products and services. In this article, you’ll learn about the benefits of reproducible data science and how to ingrain reproducibility in every data science project. You’ll also learn how to cultivate an organizational culture that promotes greater reproducibility, accountability, and scalability. What does it mean to be reproducible? Machine learning systems are complex, incorporating code, data sets, models, hyperparameters, pipelines, third-party packages, model training and development configurations across machines, operating systems, and environments. To put it simply, reproducing a data science experiment is difficult if not impossible if you can’t recreate the exact same conditions used to build the model. To do that, all artifacts have to be captured and versioned in an accessible repository. That way when a model needs to be reproduced, the exact environment, using the exact training data and code, within the exact package combination can be recreated easily. Too often it's an archeological expedition that can take weeks or months (or potentially never) when the artifacts are not captured at the time of creation. While the focus on reproducibility is a phenomenon in data science, it has been a cornerstone of scientific research across all kinds of industries, including clinical and life sciences, healthcare, and finance. If your company is unable to produce consistent experimental results, that can significantly impact your productivity, waste valuable resources, and impair decision-making. Situations Where Reproducibility Matters In data science, reproducibility is especially vital for data scientists to apply the experimental findings to their own work. Regulatory Compliance In highly regulated industries like insurance, finance and life sciences, all aspects of a model have to be documented and captured to provide full transparency, justification and validation on how models are developed and used inside an organization. This includes the type of algorithm being used, why the algorithm has been selected and how the model has been implemented within the business. A big part of complying involves being able to exactly reproduce the results of a model at any time. Without a system for capturing the artifacts, code, data, environment, packages and tools used to build a model this can be a time consuming, difficult task. Model Validation In all industries models should be validated prior to deployment to ensure the results are repeatable, understood and the model will achieve its intended purpose. Too often this is a time intensive process with validation teams having to piece together the environment, tools, data and other artifacts that were used to create the model, which slows down moving a model into production. When an organization is able to reproduce a model instantly, validators can focus on their core function of ensuring the model is robust and accurate. Collaboration Data science innovation happens when teams are able to collaborate and compound knowledge. It doesn’t happen when they have to spend time painstakingly recreating a prior experiment or accidentally duplicate work. When all work is easily reproducible, and easily searched, it's easy to build on prior work to innovate. It also means that as team staffing changes, institutional knowledge doesn’t disappear. Ingraining Reproducibility in Data Science Projects Instilling a culture of reproducibility in data science across an organization requires a long-term strategy, technology investment, and buy-in from data and engineering leadership. In this section, you’ll learn about a few established best practices for conducting and promoting reproducible data science work in your industry. Version Control Version control refers to the process of tracking and managing changes to artifacts, like code, data, labels, models, hyperparameters, experiments, dependencies, documentation, as well as environments for training and inference. The building blocks of version control for data science are more complex than software projects, making reproducibility that much more difficult and challenging. For code, there are multiple platforms, like GitHub, GitLab, and Bitbucket, that can be used to store, update, and track code, like Python scripts, Jupyter Notebooks, and configuration files, in common repositories. However that isn’t sufficient. Datasets need to be captured and versioned as well. So do the environments, tools and packages. This is because code may or may not run the same on a different version of Python or R, for example. Data may have changed even if pulled with the same parameters. Similarly capturing different versions of models and corresponding hyperparameters for each experiment is important to reproduce and replicate the results of a winning model that might be deployed to production. Reproducing end-to-end data science experiments is a complex, technical challenge that can be achieved much more efficiently using platforms like Domino’s Enterprise MLOps platform which eliminates all manual work and ensures reproducibility at scale. Scalable Systems Building accurate and reproducible data science models requires robust and scalable infrastructure for data storage and warehousing, data pipelines, feature stores, model stores, deployment pipelines, and experiment tracking. For machine learning models that serve predictions in real time, the importance of reproducibility is even higher in order to quickly resolve bugs and performance issues. End-to-end machine learning pipelines involve multiple components, and an organizational strategy for reproducible data science work must carefully plan for the tooling and infrastructure to enable it. Engineering reproducible workflows requires sophisticated tooling to encompass code, data, models, dependencies, experiments, pipelines, and runtime environments. For many organizations, it makes sense to buy (vs. build) such scalable workflows focused on reproducible data science. Conclusion Reproducible research is a cornerstone of scientific research. Reproducibility is especially significant for cross-functional disciplines like data science that involve multiple artifacts, like code, data, models, and hyperparameters, as well as a diverse set of practitioners and stakeholders. Reproducing complex experiments and results is, therefore, essential for teams and organizations when making important decisions like which models to deploy, identifying root causes when the models break down, and building trust in data science work. Reproducing data science results requires a complex set of processes and infrastructure that is not easy or necessary for many teams and companies to build in-house. Related Blogs Published by Unbox.ai Introduction
Machine learning models, especially deep neural networks, are trained using large amounts of data. However, for many machine learning use cases, real-world data sets do not exist or are prohibitively costly to buy and label. In such scenarios, synthetic data represents an appealing, less expensive, and scalable solution. Additionally, several real-world machine learning problems suffer from class imbalance—that is, where the distribution of the categories of data is skewed, resulting in disproportionately fewer observations for one or more categories. Synthetic data can be used in such situations to balance out the underrepresented data and train models that generalize well in real-world settings. Synthetic data is now increasingly used for various applications, such as computer vision, image recognition, speech recognition, and time-series data, among others. In this article, you will learn about synthetic data, its benefits, and how it is generated for different use cases. What is synthetic data? Synthetic data is a form of data augmentation that is commonly used to address overfitting deep learning models. It’s generated with algorithms as well as machine learning models to have similar statistical properties as the real-world data sets. For data-hungry deep learning models, the availability of large training data sets is a massive bottleneck that can often be solved with synthetic data. Additionally, synthetic data can be used for myriad business problems where real-world data sets are missing or underrepresented. Several industries—like consumer tech, finance, healthcare, manufacturing, security, automotive, and robotics—are already benefiting from the use of synthetic data. It helps avoid the key bottleneck in the machine learning lifecycle of the unavailability of data and allows teams to continue developing and iterating on innovative data products. For example, building products related to natural language processing (NLP), like search or language translation, is often problematic for low-resource languages. Synthetic data generation has been successfully used to generate parallel training data for training deep learning models for neural machine translation. Generating synthetic data for machine learning There are several standard approaches for generating synthetic data. These include the following:
Types of synthetic data Synthetic data can be classified into different types based on their usage and the data format. Generally, it falls into one of two categories:
Popular types of synthetic data, classified according to the data type, include the following:
Synthetic text finds its use in applications like language translation, content moderation, and product reviews. Synthetic images are used extensively for purposes like training self-driving cars, while synthetic audio and video data is used for applications including speech recognition, virtual assistants, and digital avatars. Synthetic time-series data are used in financial services to represent the temporal aspect of financial data, like stock price. Finally, synthetic tabular data is used in domains like e-commerce and fraud. Techniques for generating synthetic data Generating synthetic data can be very simple, such as adding noise to data samples, and can also be highly sophisticated, requiring the use of state-of-the-art models like generative adversarial networks. In this section, you’ll review two chief methods for generating synthetic data for machine learning and deep learning applications. Statistical methods In statistics, data samples can be assumed to be generated from a probability distribution with certain characteristic statistical features like mean, variance, skew, and so on. For instance, in the case of anomaly detection, one assumes that the nonanomalous samples belong to a certain statistical distribution while the anomalous or outlier samples do not correspond to this data distribution. Consider a hypothetical machine learning example of predicting the salaries of data scientists with certain years of experience at top tech companies. In the absence of real-world salary data, which is a topic considered taboo, synthetic salary data can be generated from a distribution defined by the few real-world salary public reports on platforms like Glassdoor, LinkedIn, or Quora. This can be used by recruiters and hiring teams to benchmark their own salary levels and adjust the salary offers to new hires. Deep learning-based methods As the complexity of the data increases, statistical-sampling-based methods are not a good choice for synthetic data generation. Neural networks, especially deep neural networks, are capable of making better approximations of complex, nonlinear data like faces or speech. A neural network essentially represents a transformation from a set of inputs to a complex output, and this transformation can be applied on synthetic inputs to generate synthetic outputs. Two popular neural network architectures for generating synthetic data are variational autoencoders and generative adversarial networks, which will be discussed in detail in the next sections. Variational autoencoders Variational autoencoders are generative models that belong to the autoencoder class of unsupervised models. They learn the underlying distribution of a data set and subsequently generate new data based on the learned representation. VAEs consist of two neural networks: an encoder that learns an efficient latent representation of the source data distribution and a decoder that aims to transform this latent representation back into the original space. The advantage of using VAEs is that the quality of the generated samples can be quantified objectively using the reconstruction error between the original distribution and the output of the decoder. VAEs can be trained efficiently through an objective function that minimizes the reconstruction error. VAEs represent a strong baseline approach for generating synthetic data. However, VAEs suffer from a few disadvantages. They are not able to learn efficient representations of heterogeneous data and are not straightforward to train and optimize. These problems can be overcome using generative adversarial networks. Generative adversarial networks GANs are a relatively new class of generative deep learning models. Like VAEs, GANs are based on simultaneously training two neural networks but via an adversarial process. A generative model, G, is used to learn the latent representation of the original data set and generate samples. The discriminator model, D, is a supervised model that learns to distinguish whether a random sample came from the original data set or is generated by G. The objective of the generator G is to maximize the probability of the discriminator D, making a classification error. This adversarial training process, similar to a zero-sum game, is continued until the discriminator can no longer distinguish between the original and synthetic data samples from the generator. GANs originally became popular for synthesizing images for a variety of computer-visionproblems, including image recognition, text-to-image and image-to-image translation, super resolution, and so on. Recently, GANs have proven to be highly versatile and useful for generating synthetic text as well as private or sensitive data like patient medical records. Synthetic data generation with Openlayer Openlayer is a machine learning debugging workspace that helps individual data scientists and enterprise organizations alike to track and version models, uncover errors, and generate synthetic data. It is primarily used to augment underrepresented portions or classes in the original training data set. Synthetic data is generated from existing data samples, and data-augmentation tests are conducted to verify whether the model’s predictions on the synthetic data are the same as for the original data. Conclusion In this article, you learned about synthetic data for machine learning and deep learning applications. In the absence of real-world data, as well as other pertinent issues like privacy concerns or the high costs of data acquisition and labeling, synthetic data presents a versatile and scalable solution. Synthetic data has found mainstream acceptance in a number of domains and for a variety of data types, including text, audio, video, time series, and tabular data. You explored these different types of synthetic data and the various methods for generation. These include statistical approaches as well as neural network–based methods like variational autoencoders and generative adversarial networks. Then you walked through a brief tutorial for generating synthetic data using deep learning methods. Finally, you saw the utility of third-party synthetic data generation products such as Openlayer, which can help companies rapidly scale their synthetic data requirements and accelerate model development and deployment. Related Blogs
Published by Earthly.dev Preview:
Bash (bourne again shell) scripts give you the ability to turn series of manual commands into an easily runnable and repeatable script. This can be especially useful when working with files. For programmers, Bash enables you to efficiently search for particular keywords or phrases by reading each line separately. Bash can also be used for reading files for a variety of reasons, like shell scripting, searching, text processing, building processes, logging data, and automating administrative tasks. When you’re done with this article, you’ll be able to use Bash to read files line by line, use custom delimiters, assign variables, and more. 👉 Here is the full article Published by Domino Data Lab Data governance refers to the process of managing enterprise data with the aim of making data more accessible, reliable, usable, secure, and compliant across an organization. It is a critical feature of organizational data management and promotes better data quality and data democratization.
A well-planned data-governance framework is fundamental for any data-driven organization that aims to harness the business value of its data and downstream capabilities that drive robust decision-making. It covers and details best practices for data processes, roles, policies, standards, and metrics. Naturally, data-governance frameworks vary from one organization to the next. Here are a few examples of strong data-governance frameworks recommended at companies like PWC, Hubspot, and ING. However, there are a set of commonly accepted best practices, as listed below:
In this article, you’ll learn more about data-governance frameworks and their essential components, exploring use cases and best practices for choosing a data-governance framework for your organization. The Importance of Data Governance Without effective data governance, organization's data science teams fail to extract the full value of their data. Weak data governance leads to poor data practices and decision-making, causing organizations to lose their competitive edge in an increasingly data-driven corporate environment. Crucially, poor governance can also impair compliance with regulatory standards like GDPR, HIPAA, SOX, CCPA, and the like, which can have massive consequences for businesses. Hefty fines for violating such laws can cause a dent in a company’s bottom line. For instance, in 2021, Amazon received a whopping GDPR fine of $877 million. Strong data governance ensures that data is readily available, reliable, consistent, and of high quality to empower businesses to create value from the data. It encompasses processes, people, organizational bodies, and a set of policies that all work together to determine best practices of managing data. The Benefits of Data Governance The benefits of data governance are manifold, some of which include the following:
Investing in a robust data-governance framework yields significant returns and helps accelerate an organization’s digital- and data-transformation journey. How to Choose a Data Governance Framework There are several foundations of a modern data-governance framework. The primary focus areas include data quality, accessibility, security, and compliance. However, the success of a data-governance framework cannot be realized until people, processes, and technology are combined effectively. Designing an effective data-governance framework also includes creating a clear set of organizational roles, responsibilities, and data stakeholders for enforcing and managing the governance policy. In this section, you’ll read about the core aspects of building an optimal data-governance framework. Data Accuracy Data accuracy is a central pillar of data quality and refers to error-free and reliable information. Inaccurate data is often the result of poor data entry practices, poor regulation of data accessibility, and poor data quality standards. It is critical to improve data accuracy standards as clean, consolidated, and accurate data can lead to a two times improvement on the return on investment. There are many ways to test and improve existing data accuracy standards. A real-time data quality audit can identify issues like duplicates, missing values, incomplete information, data being stored in multiple locations, and so on. Some of these common issues can be fixed through tools that automate data quality and accuracy checks, while other issues require manual intervention by data teams. Data Relevance Data relevance refers to whether the data is pertinent and applicable for deriving business value (i.e., whether it is fit for the purpose it was originally intended for). For instance, information about customers’ sexual orientation and military records are often asked on forms alongside relevant data fields like customer name, email, and other contact details. However, in many cases, data fields like sexual orientation and military records have no material consequence for the business. In terms of data governance, every data set needs to be rigorously assessed for its relevance and potential value to the organization. As organizations accumulate more and more data, the cost of data storage, maintenance, privacy, and security increases. Therefore, not having robust data-relevance checks can have a significant financial impact as well. Scope of Policy In the context of modern data-driven organizations, data governance has a broad scope and covers everything from metadata and data storage to accessibility, quality, security, ownership, and organizational roles and policies for various processes, people, and technology. Formulating a comprehensive data-governance policy that covers such a wide scope requires concerted efforts from a variety of data stakeholders as well as the executive leadership. As this requires significant investment in talent and technology—where ROI may not be evident in the short term—buy-in and support from leadership is critical. Data Compliance Standards Adherence to data compliance standards like the GDPR, HIPAA, SOX, and the like is another crucial element of data governance. As organizations store a lot of confidential user and business data—including personally identifiable information like names, contact details and addresses, passwords, credit card details, and so on—failure to adequately secure this data from adversarial attacks and data breaches, or even mistaken internal access, has massive business consequences. Lack of compliance to data privacy and security regulations can result in tremendous fines. Perhaps even more significant is the reputational damage to an organization that fails to protect its customer and enterprise data, leading to greater expenses and the possibility of significant loss of revenue and future business. Data Access Policy A data access policy sets out which employees can access an organization’s data so that they do not face much friction and interference in their daily work that relies on data. Under a data-access policy, only a certain set of employees are authorized to access and use data for specific use cases. This policy is applicable to all the data assets across business units and encompasses data of all types and formats. Clear guidelines on who has access and who does not also helps improve data security, promote better adherence to data compliance regulations, and reduce wastage of organizational time and resources. Organizational Roles for Managing a Data Governance Policy Data governance is the mandate of several stakeholders, such as the following:
Stages of Implementing Policy Implementing a well-planned and comprehensive data-governance framework takes time and resources. It involves multiple steps, typically including the following:
It is important to start small and slowly build traction, gaining the confidence of the leadership as well as the various data stakeholders with every step in the process. Involving a variety of stakeholders as discussed above and testing the governance framework in a small-sized team helps to identify key practices and standards that can then be scaled to the level of the whole organization. Conclusion In this article, you learned about data-governance frameworks for organizations. Data governance is a fundamental requirement for data-driven companies that helps them manage in-house data assets effectively and create consistent business value.The importance of data governance for modern organizations is great, and the negative consequences of poor governance practices are significant. Choosing a data-governance framework is not straightforward, but exploring the core pillars of strong data governance, including data accuracy, relevance, compliance, and security is an important first step towards modernizing your organization's journey in digital transformation. In the context of data science and machine learning, a robust data-governance framework is essential to maintain the quality, relevance, timeliness, completeness, accuracy, and validity of the data used to train machine learning models. Related Blogs
Published by Unbox.ai Data drift refers to the phenomenon where the distribution of live, real-world data differs or “drifts” from the distribution of data used to train a machine learning model. When data drift occurs, the performance of machine learning models in production degrades, resulting in inaccurate predictions. This reduction in the model’s predictive power can adversely impact the expected business value from the investment in training. If data drift is not identified in time, the machine learning model may become stale and eventually useless.
In this article, you’ll learn more about data drift, exploring why and in what ways it occurs, its impact, and how it can be mitigated and prevented. The Importance of Detecting Data Drift Machine learning models operate in a dynamic environment but are trained on data from a fixed, statistical distribution. Data drift can occur due to a variety of reasons, including seasonal variations, new product features, changes in customer behavior, or even rare events like the Covid-19 pandemic. Data drift is a critical challenge for production machine learning systems. It occurs when the statistical distribution of the target or real-world data diverges significantly from the statistical properties of the data on which the model was trained. This hurts model performance on new unseen data during real-world inference, leading to inaccurate predictions, poor customer experience, and monetary and reputational costs for the business. If undetected, data drift can cause multiple problems besides the obvious loss in model performance. It leads to greater MLOps challenges and technical burden for teams such as identifying data drift, conducting root cause analysis for input features correlated with data drift, data labeling, active learning, retraining, and redeploying the updated models to production. This is a significant investment of time and resources that can be avoided if machine learning models are closely monitored and a strategy for detecting and fixing data drift is in place. How to Identify Data Drift It is common to assume that a loss in model performance may be due to data drift. However, before arriving at this conclusion, it is important to assess data quality. Target data distributions could change due to a new set of users, a feature or product update, or even something as simple as a bug or formatting error in the code or data. After data-quality issues are ruled out, data drift can be examined in more detail. Fundamentally, data drift implies a change in the statistical distribution of target data from that of the training data. Thus, the simplest way to identify data drift is to compare summary statistics (like mean, variance, Kullback–Leibler divergence, and so on) of a carefully sampled subset of the target data against the training data. Other statistical measures include comparing the number of outliers in the two distributions or using the Kolmogorov–Smirnov test. Analyzing the correlations between input features and model predictions for both the data distributions can also shed some light. Model-based machine learning techniques can also be used to identify data drift. A sample of data from the reference or training distribution can be labeled as 0, and an equivalent sample from the target distribution can be labeled as 1. Based on this input data, a simple binary classification model can be trained to discriminate between the two types of data distributions. If the model can distinguish between the two data sets, this implies that data drift is present. Alternatively, if the model fails to discriminate between the data sets, then no data drift is evident. Using a machine learning–based approach captures nonlinear relationships better and can help catch data drift where the above statistical methods might fail. What are the different kinds of Data Drift? The change in the statistical distribution between the target and training data manifests in different forms of data drift that are observed in real-world machine learning systems: Covariate shift (feature drift) Covariate drift refers to a data drift that is correlated with a shift in the independent variables or input features. The relationship between the features and target variables is unchanged, but the change in a few features leads to covariate drift. Covariate drift can occur due to sample selection bias and is frequently observed in nonstationary environments. Concept drift Concept drift is associated with a change in the relationship between the independent variables and the target variables. For instance, a particular machine learning model may suffer from concept drift when it is launched in a new geography where the customer behavior is markedly different from the behavioral data from the original geography that was used to train the models. Although the set of input features and the data distributions may remain the same, the model may not make any useful predictions and is rendered obsolete. How can you mitigate and prevent data drift? Once data drift is confirmed as real and significant after rigorous analysis and statistical tests as described above, it is important to address it sooner than later. Here are a few strategies for doing so. Data labeling Labeling the new target data is the first step toward addressing data drift. A carefully selected batch of the test data can be sampled and sent to subject matter experts for data annotation. Thereafter, this labeled target data from the modified data distribution can be incorporated into the original data distribution to ameliorate the impact of data drift. Periodic model training With newly labeled target data, the model can be retrained on data from both the original distribution and the test distribution. As the new model is now trained to recognize data from the modified target distribution, it typically does a better job in production than the original model. However, a model might need to be trained multiple times, depending on the rate of data drift, to capture the new patterns from the test data. Model recalibration With repeated model retraining, the training pipeline, model architecture, and hyperparameters may remain the same, with the only difference being the change in training data. However, if data drift is not taken care of with periodic retraining, it might be prudent to train the model from scratch with a fresh approach and insights learned from efforts focused on evaluating and mitigating data drift. The new model may be trained differently from the original one in a number of ways:
Continuous monitoring Continuous monitoring of machine learning model performance is critical to keep track of the quality of the model in production. Model performance metrics like true positives, false positives, precision, recall, F1-score, and AUC-ROC curves can be periodically assessed. After thresholds for such performance metrics are carefully selected, alerts can be triggered using platforms like Grafana or Prometheus or by using third-party-managed MLOps platforms. Apart from output metrics, other things to monitor include any data issues or inconsistencies, bias in training data, and explainability metrics. Conclusion The phenomenon of data drift afflicts most machine learning models in production, arising from various reasons due to the dynamic nature of real-world data, seasonal trends, changes in product features, software- or data-related issues, changes in customer behavior due to new competition or legislation, and even rare black swan events like the Covid-19 pandemic. Data drift can be of different types, depending on whether the relationship between the independent features and the target variables changes or not. This article has equipped you to know what data drift looks like and provided a list of best practices for identifying and mitigating it before it becomes a major MLOps challenge and renders the machine learning model unfit for its intended business purpose. Related Blogs
|
Archives
March 2024
Categories
All
Copyright © 2024, Sundeep Teki
All rights reserved. No part of these articles may be reproduced, distributed, or transmitted in any form or by any means, including electronic or mechanical methods, without the prior written permission of the author. Disclaimer
This is a personal blog. Any views or opinions represented in this blog are personal and belong solely to the blog owner and do not represent those of people, institutions or organizations that the owner may or may not be associated with in professional or personal capacity, unless explicitly stated. |
||

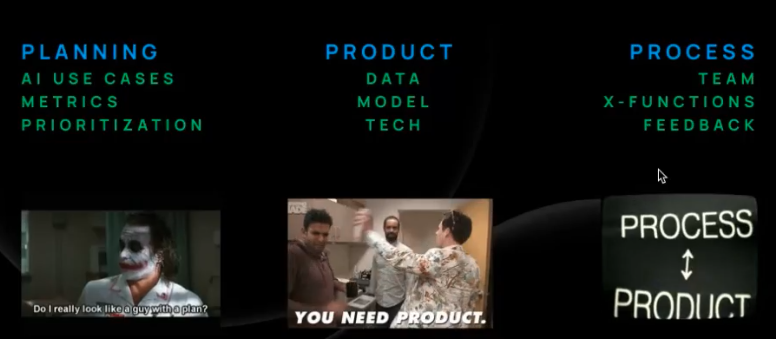
 RSS Feed